Fig. 8
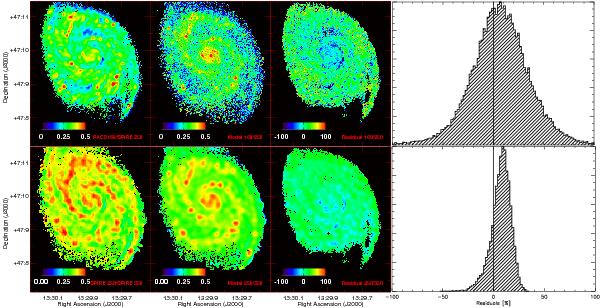
Surface brightness intensity ratio maps PACS 160 μm-to-SPIRE 250 μm (top) and SPIRE 250 μm-to-SPIRE 350 μm (bottom) as derived from observations (left panel) and radiative transfer calculations (second panel). The panels in the third and last row show the residual images and the histogram of residuals (normalized to 1 at the peak), respectively.
Current usage metrics show cumulative count of Article Views (full-text article views including HTML views, PDF and ePub downloads, according to the available data) and Abstracts Views on Vision4Press platform.
Data correspond to usage on the plateform after 2015. The current usage metrics is available 48-96 hours after online publication and is updated daily on week days.
Initial download of the metrics may take a while.