Fig. 1
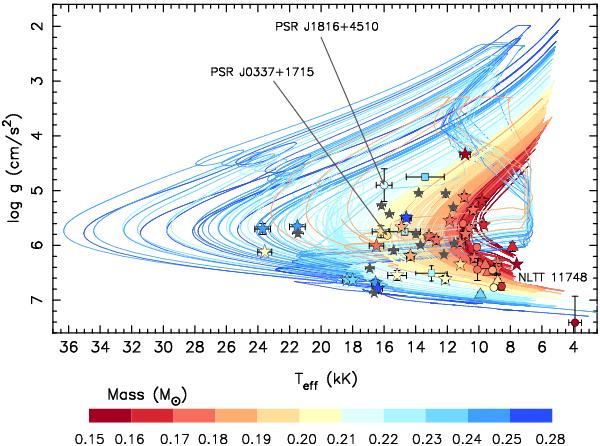
Evolutionary tracks in the (Teff,log g)-diagram. The evolution from Roche-lobe detachment until settling on the WD cooling track and beyond is shown for a selection of our models. The colour scale represents the final WD mass. A few cases of vigorous hydrogen shell flashes explain the large (counterclockwise) loops in the diagram. Observed WDs are shown with symbols (stars: sdB+WD, double WDs (grey stars: WDs with poor mass constraints); triangles: pulsating WDs; squares: WD+MS; circles: WD+MSP – see Appendix A for references and data).
Current usage metrics show cumulative count of Article Views (full-text article views including HTML views, PDF and ePub downloads, according to the available data) and Abstracts Views on Vision4Press platform.
Data correspond to usage on the plateform after 2015. The current usage metrics is available 48-96 hours after online publication and is updated daily on week days.
Initial download of the metrics may take a while.