Fig. 5
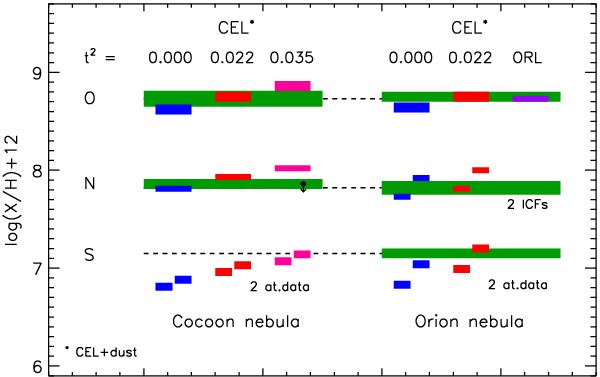
Comparison of O, N, and S abundances obtained from B-type stars (green) and nebular (gas+dust) abundances derived from CEL and different values of t2 (blue, red, and magenta). The violet box indicates O abundance obtained from ORLs in the Orion nebula by Esteban et al. (2004). The height of the boxes represents the uncertainties. Left and right columns correspond to the Cocoon and the Orion nebula. For sulphur, the resulting abundances using two different atomic datasets are indicated; for nitrogen in the Orion nebula, the abundances computed by assuming two different ICFs are shown. See text for more details.
Current usage metrics show cumulative count of Article Views (full-text article views including HTML views, PDF and ePub downloads, according to the available data) and Abstracts Views on Vision4Press platform.
Data correspond to usage on the plateform after 2015. The current usage metrics is available 48-96 hours after online publication and is updated daily on week days.
Initial download of the metrics may take a while.