Fig. 4
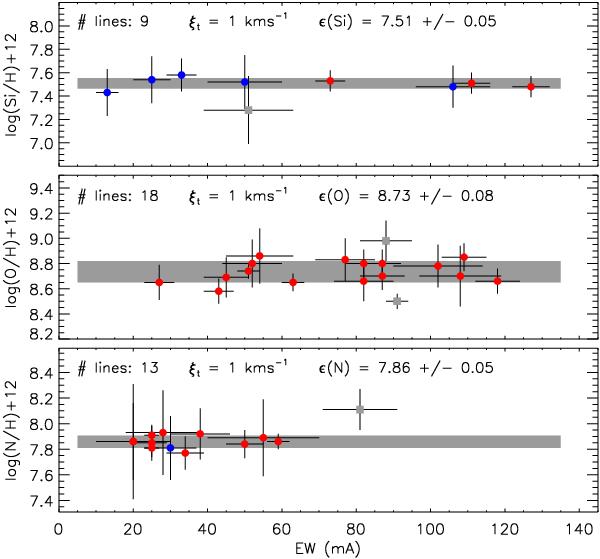
Final log(X/H) vs. EW diagrams for Si, O, and N, resulting from the abundance analysis of BD +46 4374. The microturbulence providing the lowest dispersion of line-by-line abundances is indicated at the top of each panel along with the associated mean and abundance dispersion. Red and blue dots indicate lines from different ions (red dots: Si iii, O ii and N ii; blue dots: Si iv, and N iii); gray dots correspond to the lines excluded from the analysis (see also Sect. 4 and Table 4). The gray horizontal band corresponds to the adopted value and its uncertainty.
Current usage metrics show cumulative count of Article Views (full-text article views including HTML views, PDF and ePub downloads, according to the available data) and Abstracts Views on Vision4Press platform.
Data correspond to usage on the plateform after 2015. The current usage metrics is available 48-96 hours after online publication and is updated daily on week days.
Initial download of the metrics may take a while.