Fig. 3
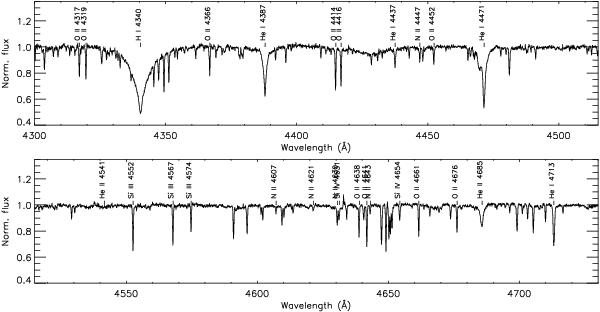
Spectrum of BD+46 3474 in the region between 4300 and 4730 Å. In contrast to the broad hydrogen Balmer and He i lines (Hγ and He iλλ 4387, 4471 and 4713 in the plotted spectral window), metal lines appear to be very narrow because of the low v sin i of the star. Only the [Si iii]-iv, [O ii], and [N ii] lines present in the plotted region and used for the spectroscopic abundance analyis are indicated in the figure (see text and Table 4).
Current usage metrics show cumulative count of Article Views (full-text article views including HTML views, PDF and ePub downloads, according to the available data) and Abstracts Views on Vision4Press platform.
Data correspond to usage on the plateform after 2015. The current usage metrics is available 48-96 hours after online publication and is updated daily on week days.
Initial download of the metrics may take a while.