Fig. 1
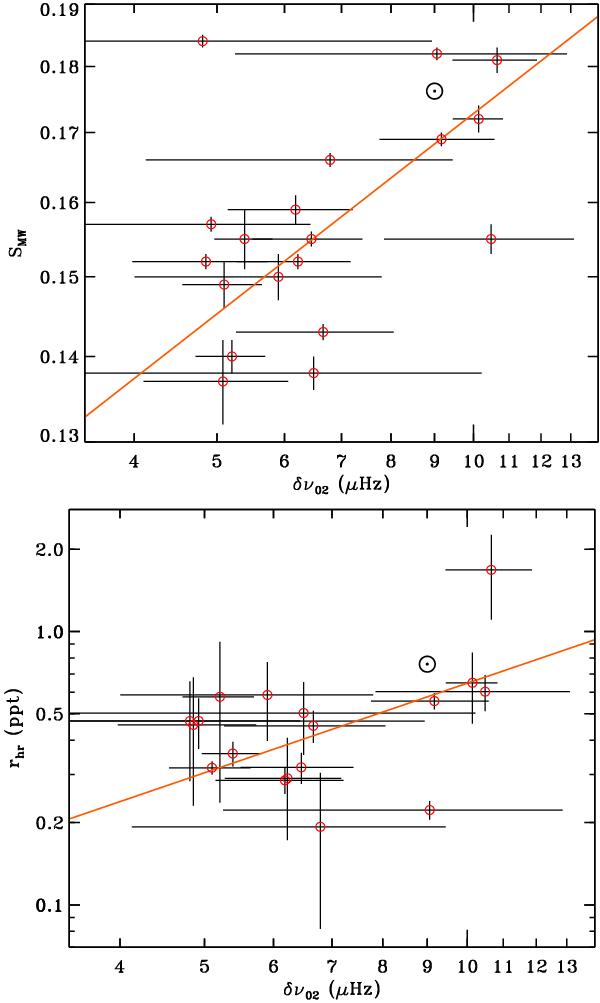
Log−log scale plot of the S index (top) and range index (bottom) as a function of the small frequency separation δν02. The orange solid line indicates the resulting Bayesian fits to Eqs. (1) and (2), respectively, while the open symbols are the measured quantities, with corresponding error bars overlaid on both axes. The Sun symbol for the range index corresponds to the value adopted by Basri et al. (2010).
Current usage metrics show cumulative count of Article Views (full-text article views including HTML views, PDF and ePub downloads, according to the available data) and Abstracts Views on Vision4Press platform.
Data correspond to usage on the plateform after 2015. The current usage metrics is available 48-96 hours after online publication and is updated daily on week days.
Initial download of the metrics may take a while.