Fig. 9
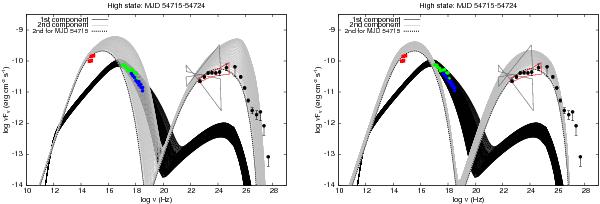
Time-dependent SEDs (grey lines) of a fiducial high-state period starting after MJD 54 715 for the two scenarios discussed in text. The results for Flares A and B are shown in the left and right panels, respectively. In both panels the last SED of the low-state for the second component is also shown with black dashed line. The first component retains the same small-amplitude variability of the low-state period (black lines). For comparison reasons, the observations of the low state period are also shown.
Current usage metrics show cumulative count of Article Views (full-text article views including HTML views, PDF and ePub downloads, according to the available data) and Abstracts Views on Vision4Press platform.
Data correspond to usage on the plateform after 2015. The current usage metrics is available 48-96 hours after online publication and is updated daily on week days.
Initial download of the metrics may take a while.