Free Access
Fig. 7
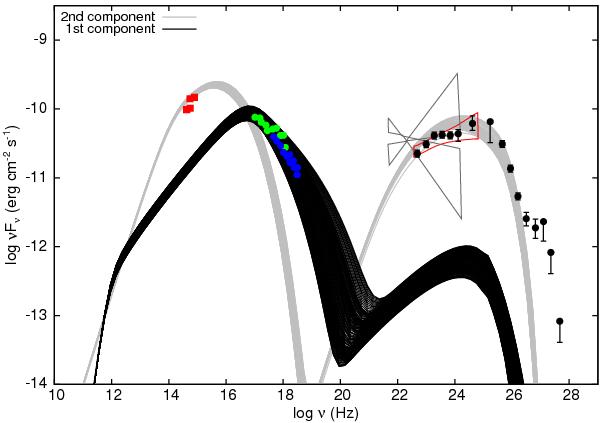
MW photon spectra calculated using the 2-SSC model for the whole period MJD 54 704–54 715 that demonstrate the difference in the range of variance of the two components. The emission from the first and second components are plotted with black and grey lines, respectively. For the parameters used, see Table 1.
Current usage metrics show cumulative count of Article Views (full-text article views including HTML views, PDF and ePub downloads, according to the available data) and Abstracts Views on Vision4Press platform.
Data correspond to usage on the plateform after 2015. The current usage metrics is available 48-96 hours after online publication and is updated daily on week days.
Initial download of the metrics may take a while.