Free Access
Fig. 5
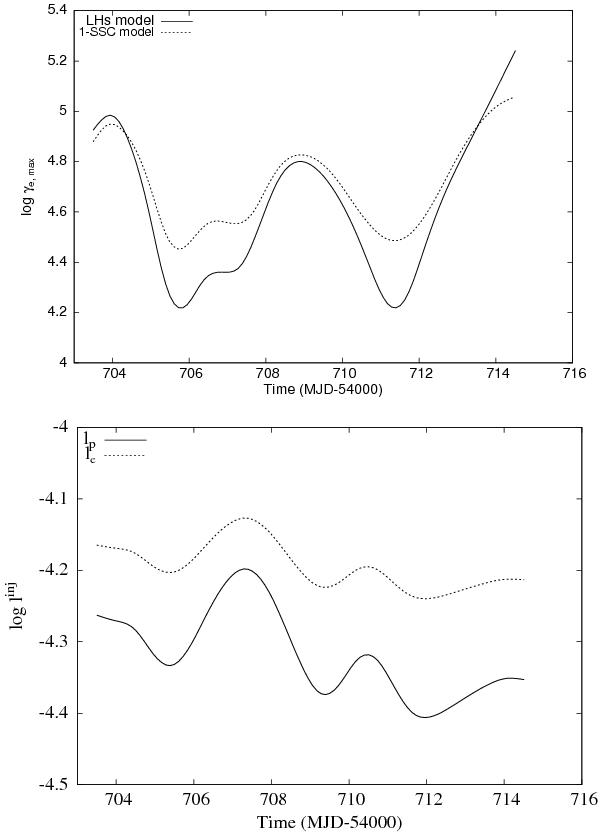
Top panel: comparison of γe,max used for the LHs (solid line) and 1-SSC (dashed line) models; for comparison reasons, the latter is shifted by a factor of –0.5 in logarithm. Bottom panel:  (solid line) and
  (dashed line) as a function of time where the former is shifted by +2.3 logarithmic units.
Current usage metrics show cumulative count of Article Views (full-text article views including HTML views, PDF and ePub downloads, according to the available data) and Abstracts Views on Vision4Press platform.
Data correspond to usage on the plateform after 2015. The current usage metrics is available 48-96 hours after online publication and is updated daily on week days.
Initial download of the metrics may take a while.