Fig. 2
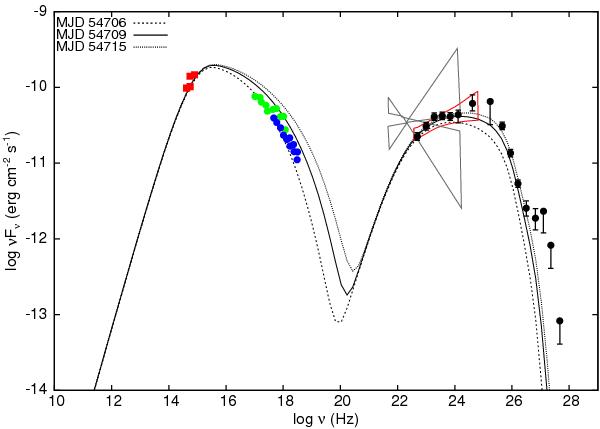
Snapshots of multiwavelength (MW) spectra during the period MJD 54 704–54 715 in the context of the one-zone SSC model. All data points are from A09. From low to high energies: optical measurements (red points) from ATOM, combined RXTE and Swift X-ray measurements (green and blue points), and gamma-ray observations (black points) by Fermi-LAT and H.E.S.S. in the GeV and TeV energy bands, respectively. The red butterfly is the actual Fermi spectrum for the period MJD 54 704–54 715 and the grey ones show EGRET measurements.
Current usage metrics show cumulative count of Article Views (full-text article views including HTML views, PDF and ePub downloads, according to the available data) and Abstracts Views on Vision4Press platform.
Data correspond to usage on the plateform after 2015. The current usage metrics is available 48-96 hours after online publication and is updated daily on week days.
Initial download of the metrics may take a while.