Free Access
Fig. 10
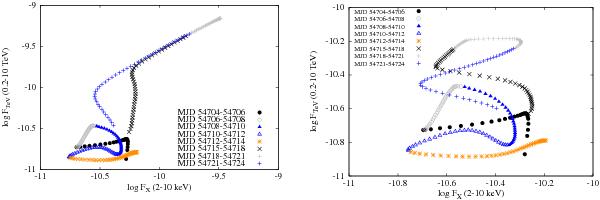
FTeV − FX plane in logarithmic scale for the periods of low and high activity. The results for flares A and B are shown in the left and right panels, respectively. Different symbols are used to denote different phases of the lightcurve.
Current usage metrics show cumulative count of Article Views (full-text article views including HTML views, PDF and ePub downloads, according to the available data) and Abstracts Views on Vision4Press platform.
Data correspond to usage on the plateform after 2015. The current usage metrics is available 48-96 hours after online publication and is updated daily on week days.
Initial download of the metrics may take a while.