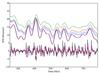
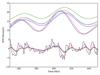
Fig. 6

Left: Fourier-filtered SFH of the MIRAGE G2_G2_90_90_90 simulation (black lines) along with the estimated SFR recomputed from each of the two filtered SFH. The top (resp. bottom) lines represent the low (resp. high) frequency component. The colours follow the same scheme as that of Fig. 3. Note that the true SFR and SFR(Ly) are nearly blended. Right: zoom between 350 Myr and 450 Myr. We find that if there are important discrepancies in the SFR, on average at high frequency the true SFR and the estimated SFR give similar results, both close to 0 Msun/yr. The behaviour at low frequency is markedly different. We see that the estimated SFR show both a systematic overestimate and a delay in time from the extrema of the true SFR. The smallest delay occurs for SFR(Ly). Conversely, SFR(FUV), SFR(NUV), SFR(U), and SFR(TIR) all show approximately similar delays of a few Myr.
Current usage metrics show cumulative count of Article Views (full-text article views including HTML views, PDF and ePub downloads, according to the available data) and Abstracts Views on Vision4Press platform.
Data correspond to usage on the plateform after 2015. The current usage metrics is available 48-96 hours after online publication and is updated daily on week days.
Initial download of the metrics may take a while.