Fig. 5
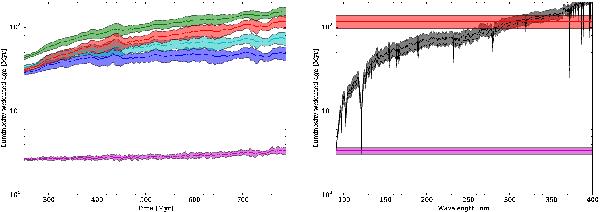
Left: luminosity weighted ages versus the simulation time. The solid lines indicate the mean value of for the 23 simulations and the shaded areas of the corresponding colours indicate the standard deviation. The colour scheme is the same as that of Fig. 3. Right: luminosity weighted ages versus wavelength (black) for a simulation age of 790 Myr. The values for the Lyman continuum and the TIR at 790 Myr are also indicated. For comparison, the corresponding values for a constant SFR over 1 Gyr shown in Fig. 2 is indicated in dashed lines.
Current usage metrics show cumulative count of Article Views (full-text article views including HTML views, PDF and ePub downloads, according to the available data) and Abstracts Views on Vision4Press platform.
Data correspond to usage on the plateform after 2015. The current usage metrics is available 48-96 hours after online publication and is updated daily on week days.
Initial download of the metrics may take a while.