Fig. 4
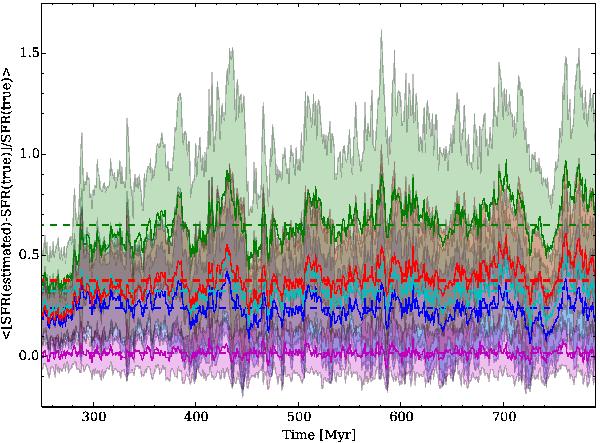
Ratio of difference between the estimated and true SFR to the true SFR versus time for the entire MIRAGE sample. The solid lines indicate the mean value across all simulations whereas the shaded areas of the same colour indicate the standard deviation. The dashed lines indicate the mean value between 250 Myr and 790 Myr. The colour coding is the same as for Fig. 3. We see that except for the Lyman continuum, the SFR is systematically overestimated, from 24% on average for the FUV band to 65% on average for the U band. Peak relative differences reach ~0.7 for the Lyman continuum, ~1.9, ~2.1, and ~3.2 for the FUV, NUV, and U bands, and ~2.0 for the TIR.
Current usage metrics show cumulative count of Article Views (full-text article views including HTML views, PDF and ePub downloads, according to the available data) and Abstracts Views on Vision4Press platform.
Data correspond to usage on the plateform after 2015. The current usage metrics is available 48-96 hours after online publication and is updated daily on week days.
Initial download of the metrics may take a while.