Fig. 3
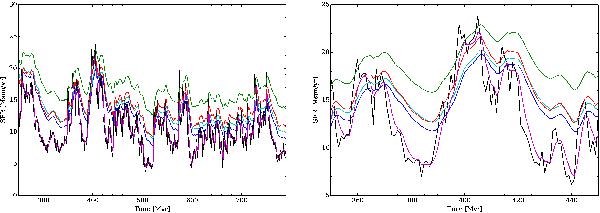
Left: true SFR (black), SFR(Ly) (magenta), SFR(FUV) (blue), SFR(NUV) (cyan), SFR(U) (green), and SFR(TIR) (red) for the MIRAGE G2_G2_90_90_90 simulation (Perret et al. 2014). Note that the true SFR and SFR(Ly) are nearly blended. Right: zoom between 350 Myr and 450 Myr. We see that SFR(Ly) follows the variations of the true SFR extremely well even for high frequency variations. SFR estimators at longer wavelengths are not able to capture these variations though, leading to important discrepancies in the estimates of the instantaneous SFR. Beyond the capture of short-term variations, we see that there is also a systematic offset that is visible in the FUV and NUV bands but which is especially prominent in the U band. For the present simulation, we obtain ⟨[SFR(FUV) − SFR(true)] /SFR(true)⟩ = 0.27 ± 0.30 between 250 Myr and 790 Myr with a peak of ~1.5. For the U band, we obtain ⟨[SFR(U) − SFR(true)] /SFR(true)⟩ = 0.70 ± 0.46 with a peak of ~2.8. This is representative of the entire MIRAGE sample as can be seen in Fig. 4.
Current usage metrics show cumulative count of Article Views (full-text article views including HTML views, PDF and ePub downloads, according to the available data) and Abstracts Views on Vision4Press platform.
Data correspond to usage on the plateform after 2015. The current usage metrics is available 48-96 hours after online publication and is updated daily on week days.
Initial download of the metrics may take a while.