Fig. 1
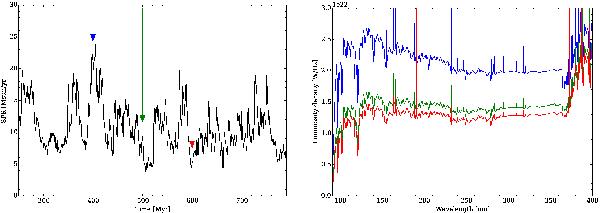
Left: SFH of the MIRAGE G2_G2_90_90_90 merger simulation (Perret et al. 2014). The time resolution is 1 Myr. The first 250 Myr are not shown as the initial relaxation is handled (Sect. 2.1). The coloured arrows at 400, 500, and 600 Myr indicate at which time we compute the spectra shown in the right-hand panel from the Lyman break to the U band. These spectra are created with the cigale SED modelling code (Boquien et al., in prep.; Burgarella et al., in prep.). In the present case we assume a Chabrier (2003) IMF and a metallicity Z = 0.008. Nebular emission is also included. It takes into account recombination lines and the nebular continuum from free-free, free-bound, and two-photon processes. The continuum contributes most in the red part of the shown spectra. We have computed the spectra for all 23 MIRAGE simulations (three isolated galaxies and 20 interacting galaxies) every 1 Myr.
Current usage metrics show cumulative count of Article Views (full-text article views including HTML views, PDF and ePub downloads, according to the available data) and Abstracts Views on Vision4Press platform.
Data correspond to usage on the plateform after 2015. The current usage metrics is available 48-96 hours after online publication and is updated daily on week days.
Initial download of the metrics may take a while.