Fig. 3
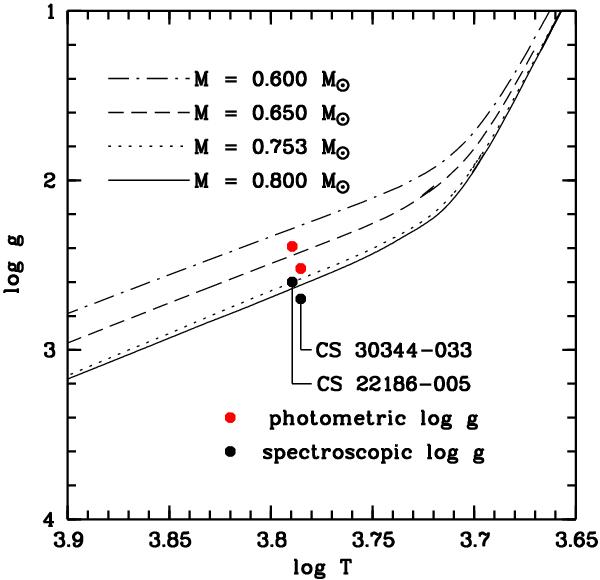
Evolutionary tracks for HB stars of different masses and metallicity Z = 0.00003 in the log T−log g plane (Cassisi et al. 2004). The black dots indicate the position of the two stars, with the spectroscopically derived log g, and the red dots correspond to the “photometric” log g, derived from the spectroscopic estimate, according to the empirical calibration of Preston et al. (2006).
Current usage metrics show cumulative count of Article Views (full-text article views including HTML views, PDF and ePub downloads, according to the available data) and Abstracts Views on Vision4Press platform.
Data correspond to usage on the plateform after 2015. The current usage metrics is available 48-96 hours after online publication and is updated daily on week days.
Initial download of the metrics may take a while.