Fig. 2
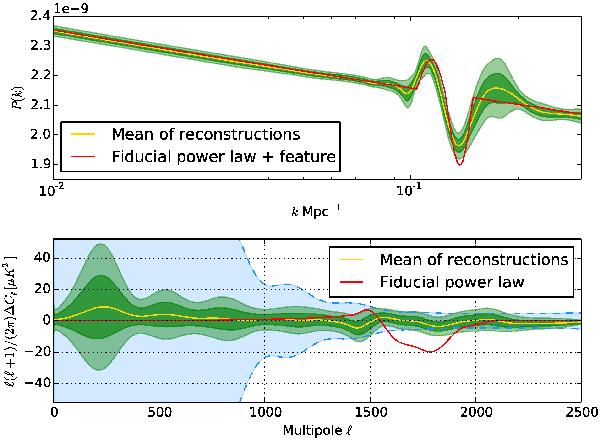
Top panel: fiducial primordial power spectrum with a feature around k = 0.125 Mpc-1 in red and in green contours the 1σ and 2σ dispersion of 100 reconstructions from simulated CMB spectra. The mean of reconstructions is shown in yellow. Bottom panel: residuals ΔCℓ between the Cℓ for the fiducial primordial power spectrum with a feature and the Cℓ for the best-fit Planck power law in red and for the mean reconstructed primordial power spectrum in yellow. The green bands indicate the 1σ and 2σ bands for the ΔCℓ from the simulations, the dashed blue lines show the 1σ region due to cosmic variance.
Current usage metrics show cumulative count of Article Views (full-text article views including HTML views, PDF and ePub downloads, according to the available data) and Abstracts Views on Vision4Press platform.
Data correspond to usage on the plateform after 2015. The current usage metrics is available 48-96 hours after online publication and is updated daily on week days.
Initial download of the metrics may take a while.