Fig. 1
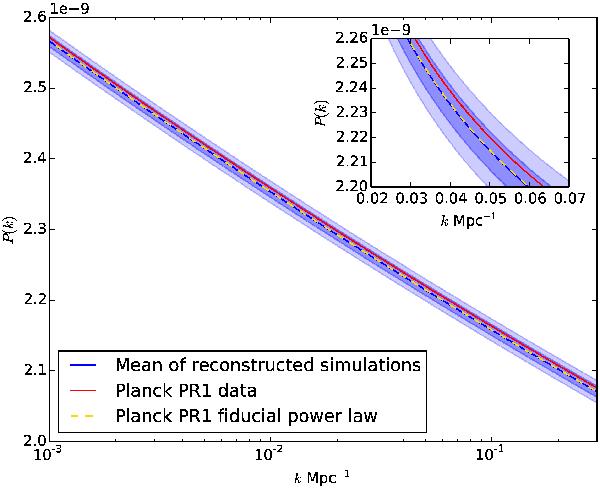
Reconstructions for the primordial power spectra from 100 simulations and Planck PR1 data. The 1σ and 2σ dispersion of the reconstructed spectra from the simulations are shown as blue bands around the mean of the reconstructions (blue line). We note that these bands do not include the errors due to point sources and beam uncertainties. The Planck fiducial power spectrum used for the simulations, with As = 2.215 × 10⁻⁹ and ns = 0.9626, is shown as a yellow dashed line. The inset shows a close-up of the main figure.
Current usage metrics show cumulative count of Article Views (full-text article views including HTML views, PDF and ePub downloads, according to the available data) and Abstracts Views on Vision4Press platform.
Data correspond to usage on the plateform after 2015. The current usage metrics is available 48-96 hours after online publication and is updated daily on week days.
Initial download of the metrics may take a while.