Fig. 6
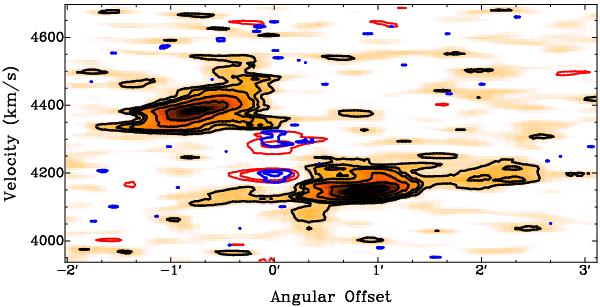
Position–velocity plot along a slice taken at PA = 108° of the H i disk. The emission is shown in black. The contour levels range between 1.7 mJy beam-1and 7 mJy beam-1, with steps of 1.4 mJy beam-1. The absorption features are circled in blue and red, at the resolutions of 11′′ and 30′′. Contour levels are −2, −8 mJy beam-1 and −1.7, −3.5 mJy beam-1, respectively. The blue-shifted emission shows an external “plume” of the disk (in the NW of the total intensity map), at lower densities with respect to the regularly rotating ring.
Current usage metrics show cumulative count of Article Views (full-text article views including HTML views, PDF and ePub downloads, according to the available data) and Abstracts Views on Vision4Press platform.
Data correspond to usage on the plateform after 2015. The current usage metrics is available 48-96 hours after online publication and is updated daily on week days.
Initial download of the metrics may take a while.