Fig. 8
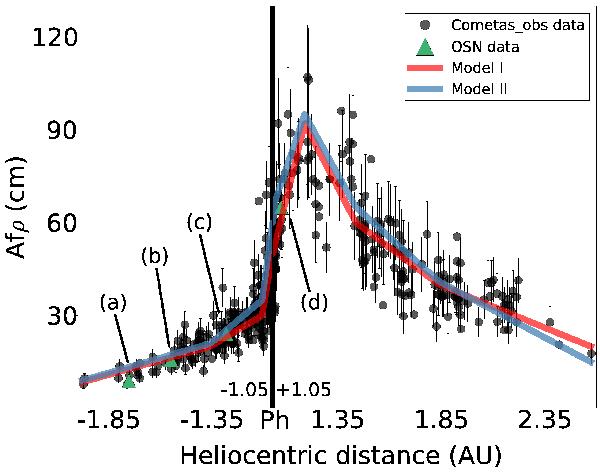
Comparison between observational data and the models proposed for the comet 103P/Hartley 2. Afρ measurements have been corrected using Eq. (1). Black dots are the data from Cometas-Obs, and green triangles marked from (a) to (d) are the observations at OSN telescope. The red line corresponds to Model I or Hyperactive model, which fits the observations in Fig. 9. The blue line is the Model II or Standard model, and its fits with observations can be checked in Fig. 10. All the Afρ values are referred to ρ = 104 km.
Current usage metrics show cumulative count of Article Views (full-text article views including HTML views, PDF and ePub downloads, according to the available data) and Abstracts Views on Vision4Press platform.
Data correspond to usage on the plateform after 2015. The current usage metrics is available 48-96 hours after online publication and is updated daily on week days.
Initial download of the metrics may take a while.