Fig. 14
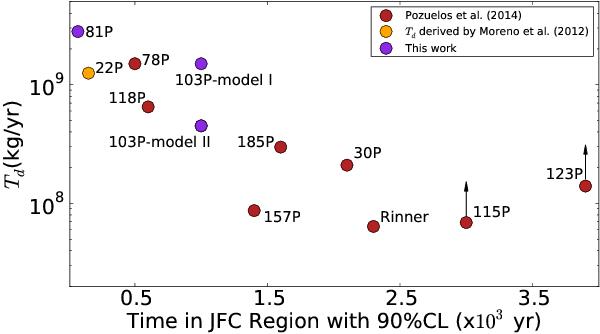
Annual dust production rate of our targets obtained in the dust analysis (see Sect. 4) versus the time in the JFCs region with a 90% C.L. derived from dynamical studies (see Sect. 5). Red circles are the results derived from Pozuelos et al. (2014); yellow circle is the comet 22P/Koppf, where dust analysis was carried out in Moreno et al. (2012); violet circles are the results of the comets 81P/Wild 2 and 103P/Hartley 2, studied in this work. The comets with arrows mean the Td given for them are lower limits (see text in Paper I).
Current usage metrics show cumulative count of Article Views (full-text article views including HTML views, PDF and ePub downloads, according to the available data) and Abstracts Views on Vision4Press platform.
Data correspond to usage on the plateform after 2015. The current usage metrics is available 48-96 hours after online publication and is updated daily on week days.
Initial download of the metrics may take a while.