Fig. 12
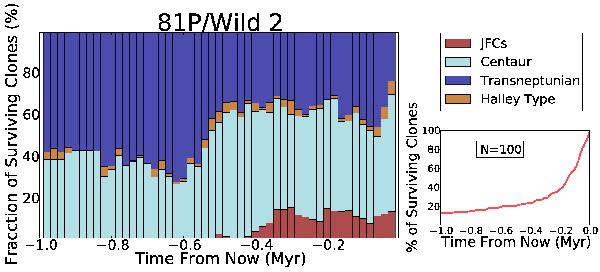
81P/Wild 2 backward in time orbital evolution during 1 Myr. Left panel: fraction of surviving clones (%) versus time from now (Myr). The colors represent the regions visited by the test particles (red: Jupiter family region; cyan: Centaur; blue: Transneptunian; yellow: Halley type). The resolution is 2 × 10⁴ yr. Right bottom panel: the % of surviving clones versus time from now (Myr), where N = 100 is the number of the initial test massless particles.
Current usage metrics show cumulative count of Article Views (full-text article views including HTML views, PDF and ePub downloads, according to the available data) and Abstracts Views on Vision4Press platform.
Data correspond to usage on the plateform after 2015. The current usage metrics is available 48-96 hours after online publication and is updated daily on week days.
Initial download of the metrics may take a while.