Fig. 6
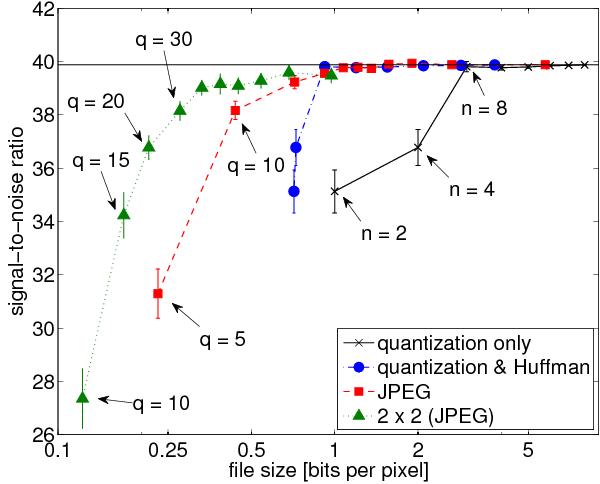
S/N of travel times (center-to-annulus geometry, outward minus inward travel times) at a wavenumber of kR⊙ = 98−147 as a function of the file size in bits per pixel (relative to the data with full spatial resolution). We show data for quantization and JPEG compression using both the full spatial resolution and 2 × 2 subsampled data. Black crosses: quantization only (full resolution), blue circles: quantization and Huffman compression (full resolution), red squares: JPEG compression (full resolution), green triangles: JPEG compression and 2 × 2 subsampling. We vary the number of possible values for the velocity n for the quantization and the quality factor q of the JPEG compression (as indicated by the arrows). We do not show the S/N for JPEG compression with q = 5 applied to 2 × 2 subsampled data because it is extremely low (S/N = 7). The S/N shown here is an average computed from twenty realizations. The horizontal line shows the S/N of the uncompressed data. Before computing the S/N, we averaged the power of the travel times from kR⊙ = 98−147. Our measurement of the S/N for the uncompressed case has an uncertainty of about 2. The error bars show error estimates for differential S/N measurements relative to the uncompressed case.
Current usage metrics show cumulative count of Article Views (full-text article views including HTML views, PDF and ePub downloads, according to the available data) and Abstracts Views on Vision4Press platform.
Data correspond to usage on the plateform after 2015. The current usage metrics is available 48-96 hours after online publication and is updated daily on week days.
Initial download of the metrics may take a while.