Fig. 5
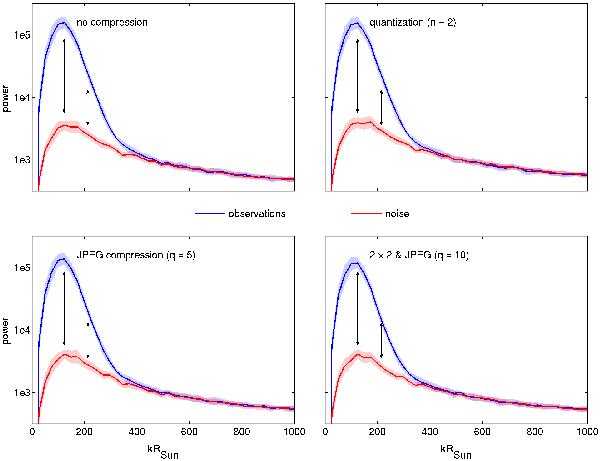
Azimuthally averaged power of travel times (center-to-annulus geometry, outward minus inward travel times) derived from observations (blue curve) and a noise model (red curve). Top left: uncompressed data, top right: quantization (two velocity bins), bottom left: JPEG compression (quality = 5), bottom right: 2 × 2 subsampling combined with JPEG compression with a quality of 10. The power shown is an average from twenty time-series, each of them having a length of eight hours. The shaded areas show the 1σ scatter of the individual realizations. The compression slightly decreases the signal and increases the noise. The vertical arrows denote the wavenumbers used for determining the S/N in Fig. 6 and Table 1.
Current usage metrics show cumulative count of Article Views (full-text article views including HTML views, PDF and ePub downloads, according to the available data) and Abstracts Views on Vision4Press platform.
Data correspond to usage on the plateform after 2015. The current usage metrics is available 48-96 hours after online publication and is updated daily on week days.
Initial download of the metrics may take a while.