Fig. 4
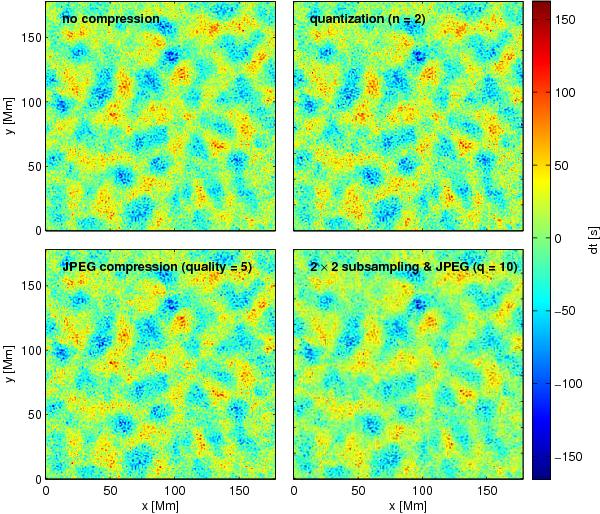
Examples of travel time maps of supergranulation (f-mode, center-to-annulus geometry, annulus size 13.4 Mm, outward minus inward travel times) computed from compressed and uncompressed Dopplergrams. Top left: uncompressed data, top right: quantization (two velocity bins), bottom left: JPEG compression (quality = 5), bottom right: 2 × 2 subsampling combined with JPEG compression with a quality of 10. The travel times clearly show the supergranulation pattern. They correspond to the divergence of horizontal flows, with negative values indicating outflows and positive values showing inflows.
Current usage metrics show cumulative count of Article Views (full-text article views including HTML views, PDF and ePub downloads, according to the available data) and Abstracts Views on Vision4Press platform.
Data correspond to usage on the plateform after 2015. The current usage metrics is available 48-96 hours after online publication and is updated daily on week days.
Initial download of the metrics may take a while.