Fig. 3
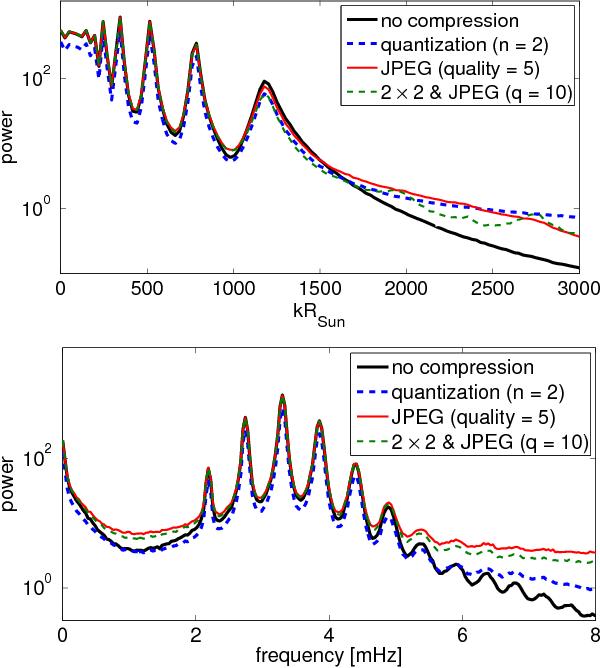
Cuts through the azimuthally averaged power spectra shown in Fig. 2 (cut along the dashed lines). Top: power at a constant frequency, ν = 3.4 mHz, bottom: power at a constant wavenumber, kR⊙ = 466. Four configurations are shown. Thick solid black curve: no compression is applied to the data, thick dashed blue curve: the Dopplergrams are compressed using quantization (two velocity bins), solid red curve: JPEG compression (quality = 5), dashed green curve: 2 × 2 subsampling and JPEG compression with a quality of 10. The power shown is an average of twenty time-series, each of them having a length of eight hours. We normalized the bit-truncated Dopplergrams to have the same variance as the uncompressed data before computing power spectra. All compression methods slightly decrease the power of the modes and add additional noise to the power.
Current usage metrics show cumulative count of Article Views (full-text article views including HTML views, PDF and ePub downloads, according to the available data) and Abstracts Views on Vision4Press platform.
Data correspond to usage on the plateform after 2015. The current usage metrics is available 48-96 hours after online publication and is updated daily on week days.
Initial download of the metrics may take a while.