Fig. 2
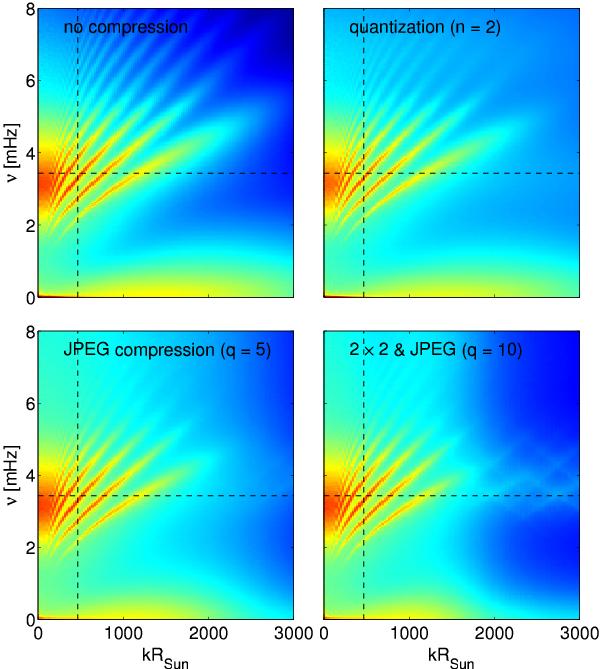
Compression artifacts in azimuthally averaged power spectra. Top left: uncompressed data, top right: quantization (two velocity bins), bottom left: JPEG compression (quality = 5), bottom right: 2 × 2 subsampling combined with JPEG compression with a quality of 10. All four power spectra are plotted using the same logarithmic color-scale (red corresponds to high power, blue to low power) and are averages from twenty time-series, each of them having a length of eight hours. We normalized the bit-truncated Dopplergrams to have the same variance as the uncompressed data before computing power spectra. All compression methods slightly decrease the power of the modes and add additional noise to the power. The noise caused by quantization is almost flat, the noise caused by JPEG compression exhibits a more complex behavior, including several ridges appearing at high wavenumbers and a reduction of the power arising from granulation. In Fig. 3, we show cuts through the power spectra along the dashed lines.
Current usage metrics show cumulative count of Article Views (full-text article views including HTML views, PDF and ePub downloads, according to the available data) and Abstracts Views on Vision4Press platform.
Data correspond to usage on the plateform after 2015. The current usage metrics is available 48-96 hours after online publication and is updated daily on week days.
Initial download of the metrics may take a while.