Fig. 8
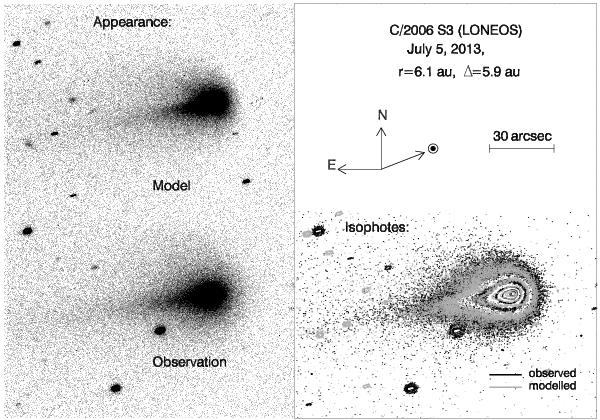
Dust environment of S3 observed on July 5, 2013 (NOT data). The modeled brightness distribution is overlaid on the observed images and shifted for clarity (left panel). The right panel illustrates the contour plots of observed and simulated brightness with dark and gray lines, respectively. The scale bar of 30′′, directions to north and east, and the Sun are marked.
Current usage metrics show cumulative count of Article Views (full-text article views including HTML views, PDF and ePub downloads, according to the available data) and Abstracts Views on Vision4Press platform.
Data correspond to usage on the plateform after 2015. The current usage metrics is available 48-96 hours after online publication and is updated daily on week days.
Initial download of the metrics may take a while.