Fig. 9
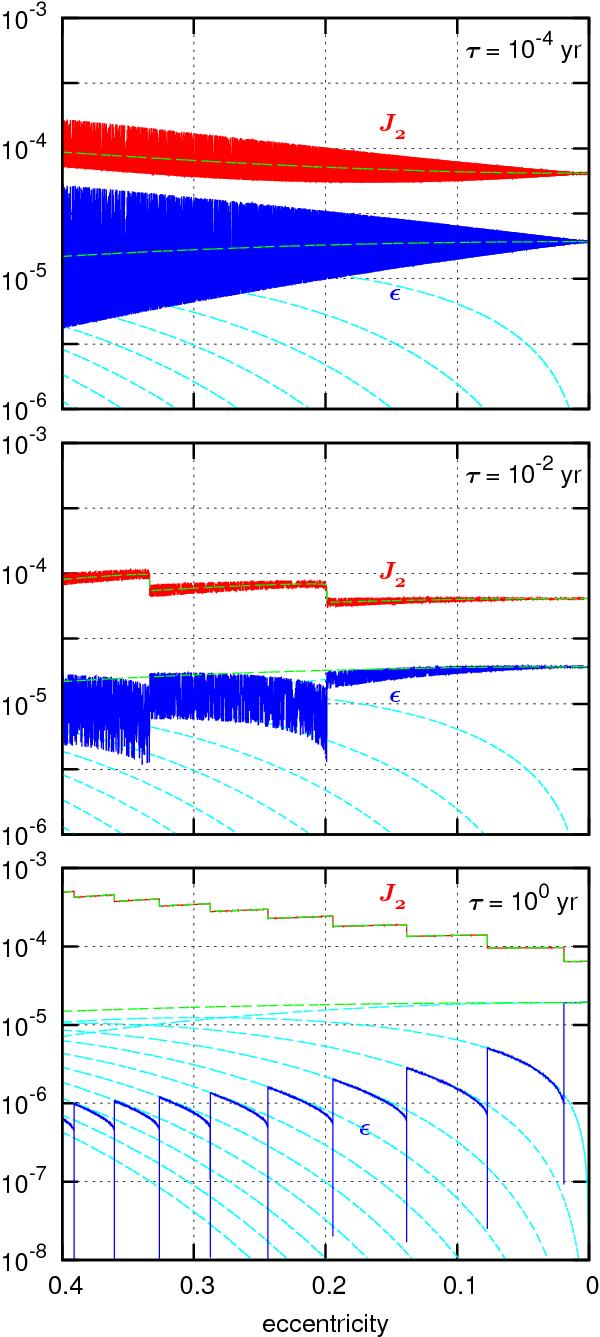
Evolution of J2 (in red) and prolateness ϵ (in blue) of HD 80606 b as a function of the eccentricity for different τ values. The green dashed line shows the average equilibrium value of these two quantities over one orbital period (Eqs. (85), (86)). The cyan dashed line shows the average equilibrium value of the prolateness for a specific spin-orbit resonance (Eq. (87)).
Current usage metrics show cumulative count of Article Views (full-text article views including HTML views, PDF and ePub downloads, according to the available data) and Abstracts Views on Vision4Press platform.
Data correspond to usage on the plateform after 2015. The current usage metrics is available 48-96 hours after online publication and is updated daily on week days.
Initial download of the metrics may take a while.