Fig. 7
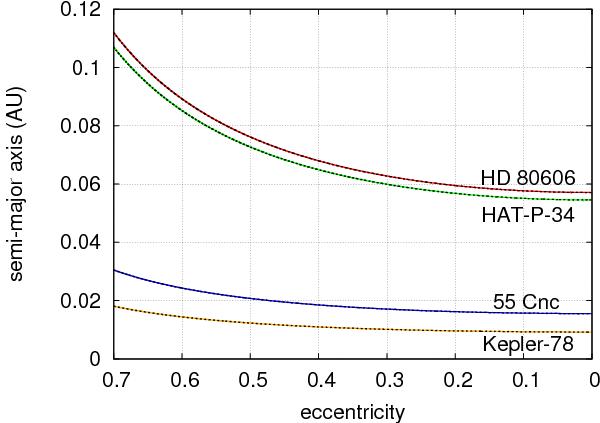
Evolution of the semi-major axis as a function of the eccentricity for different systems and τ values. The dotted lines correspond to the theoretical prediction given by expression (83). Solid lines correspond to the orbital evolution obtained using numerical simulations with different τ values. For each system, the simulations exactly match the theoretical prediction.
Current usage metrics show cumulative count of Article Views (full-text article views including HTML views, PDF and ePub downloads, according to the available data) and Abstracts Views on Vision4Press platform.
Data correspond to usage on the plateform after 2015. The current usage metrics is available 48-96 hours after online publication and is updated daily on week days.
Initial download of the metrics may take a while.