Fig. 6
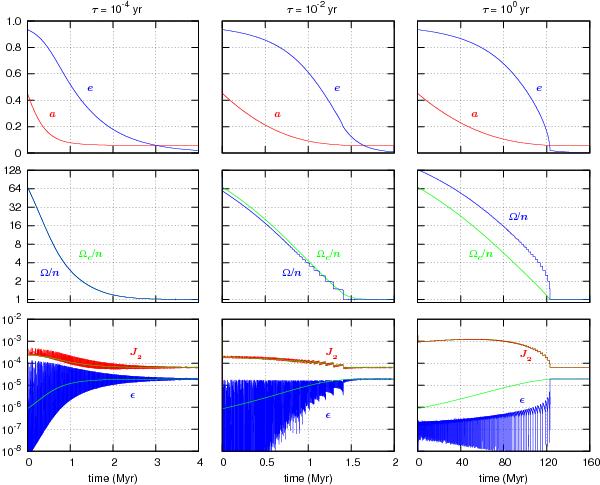
Evolution of HD 80606 b with time for different τ values. We plot the semi-major axis (in AU) and the eccentricity (top), the ratio between the planet rotation rate and the orbital mean motion (middle), and the planet J2 and ϵ (bottom). The green line gives the pseudo-synchronous equilibrium (Eq. (60)) (middle), and the average equilibrium values for J2 and ϵ, respectively (Eqs. (85) and (86)) (bottom).
Current usage metrics show cumulative count of Article Views (full-text article views including HTML views, PDF and ePub downloads, according to the available data) and Abstracts Views on Vision4Press platform.
Data correspond to usage on the plateform after 2015. The current usage metrics is available 48-96 hours after online publication and is updated daily on week days.
Initial download of the metrics may take a while.