Fig. 9
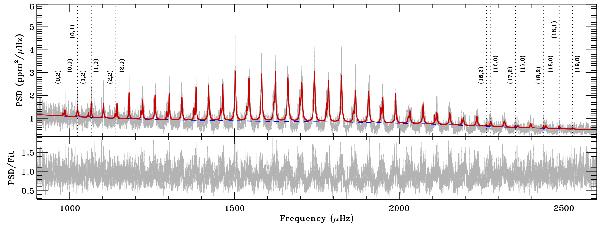
Upper panel: resulting peak bagging best-fit for KIC 9139163 as derived by means of Diamonds by using Approach 1 based on the background that is estimated in Sect. 6.2 (red thick line) overlaid on the PSD smoothed by 0.25 μHz (gray). The mean background level is shown as a dashed blue line. Dotted vertical lines mark the oscillation peaks for which the detection probability is below 99% with labels indicating the corresponding peak identification, as reported in Table A.1 and as explained in Appendix A. Lower panel: ratio between the smoothed PSD and the resulting red line fit that is shown in the upper panel.
Current usage metrics show cumulative count of Article Views (full-text article views including HTML views, PDF and ePub downloads, according to the available data) and Abstracts Views on Vision4Press platform.
Data correspond to usage on the plateform after 2015. The current usage metrics is available 48-96 hours after online publication and is updated daily on week days.
Initial download of the metrics may take a while.