Free Access
Fig. 7
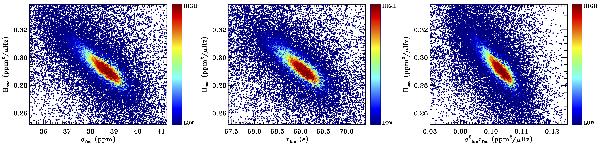
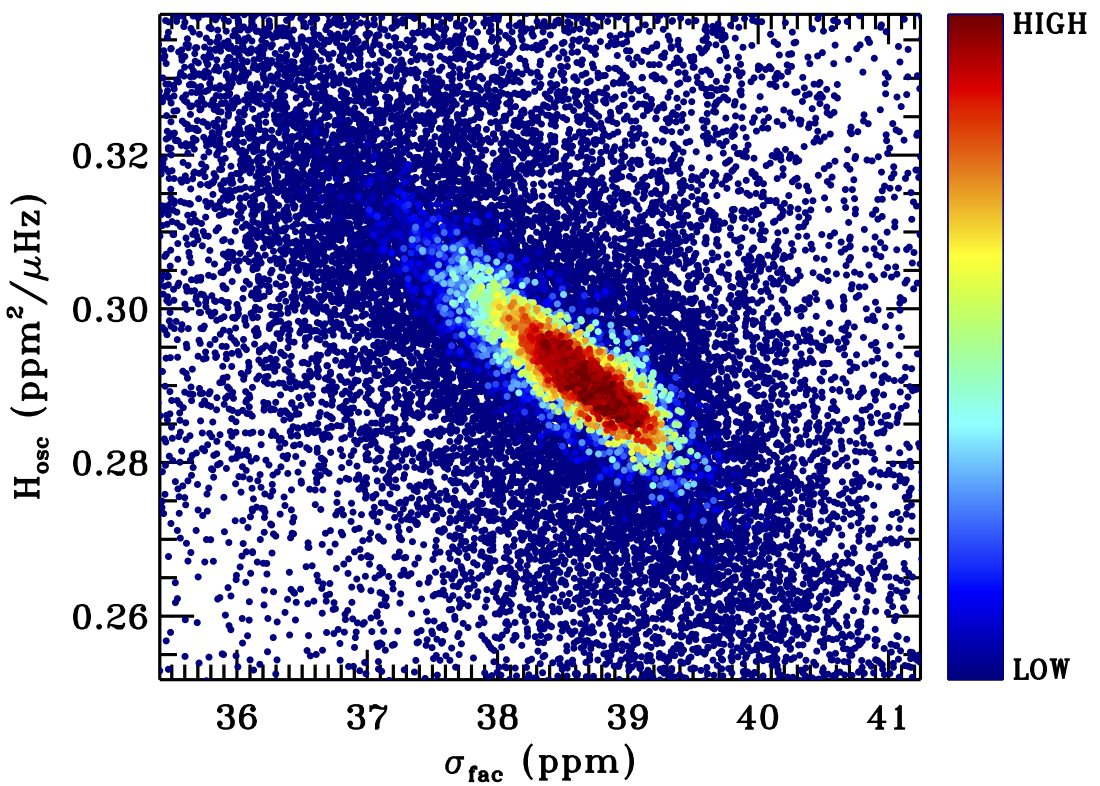
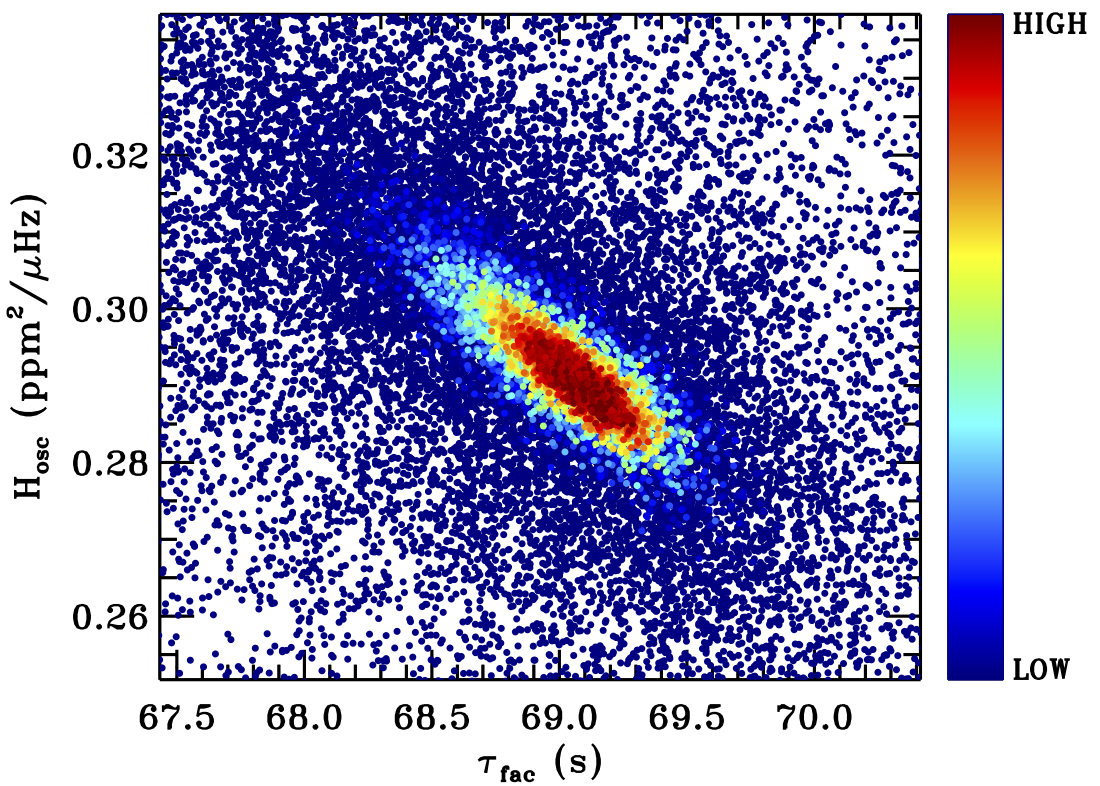
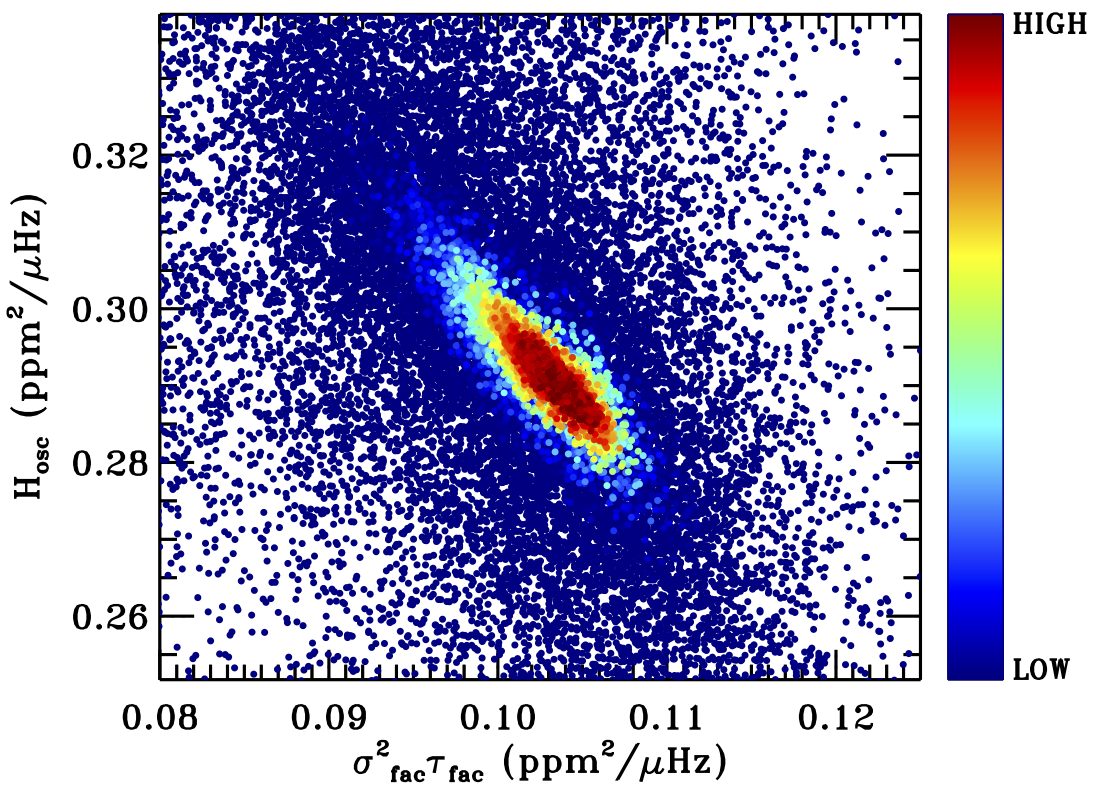
Correlation maps for the parameters describing the Harvey-like profile related to the faculae activity – namely σfac, and τfac, their combination ![]() in PSD units, and the height of the oscillation envelope Hosc with color-coded likelihood values plotted similarly to Fig. 6 – using the same sample of points.
in PSD units, and the height of the oscillation envelope Hosc with color-coded likelihood values plotted similarly to Fig. 6 – using the same sample of points.
This figure is made of several images, please see below:
Current usage metrics show cumulative count of Article Views (full-text article views including HTML views, PDF and ePub downloads, according to the available data) and Abstracts Views on Vision4Press platform.
Data correspond to usage on the plateform after 2015. The current usage metrics is available 48-96 hours after online publication and is updated daily on week days.
Initial download of the metrics may take a while.