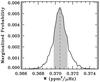
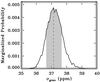
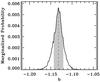
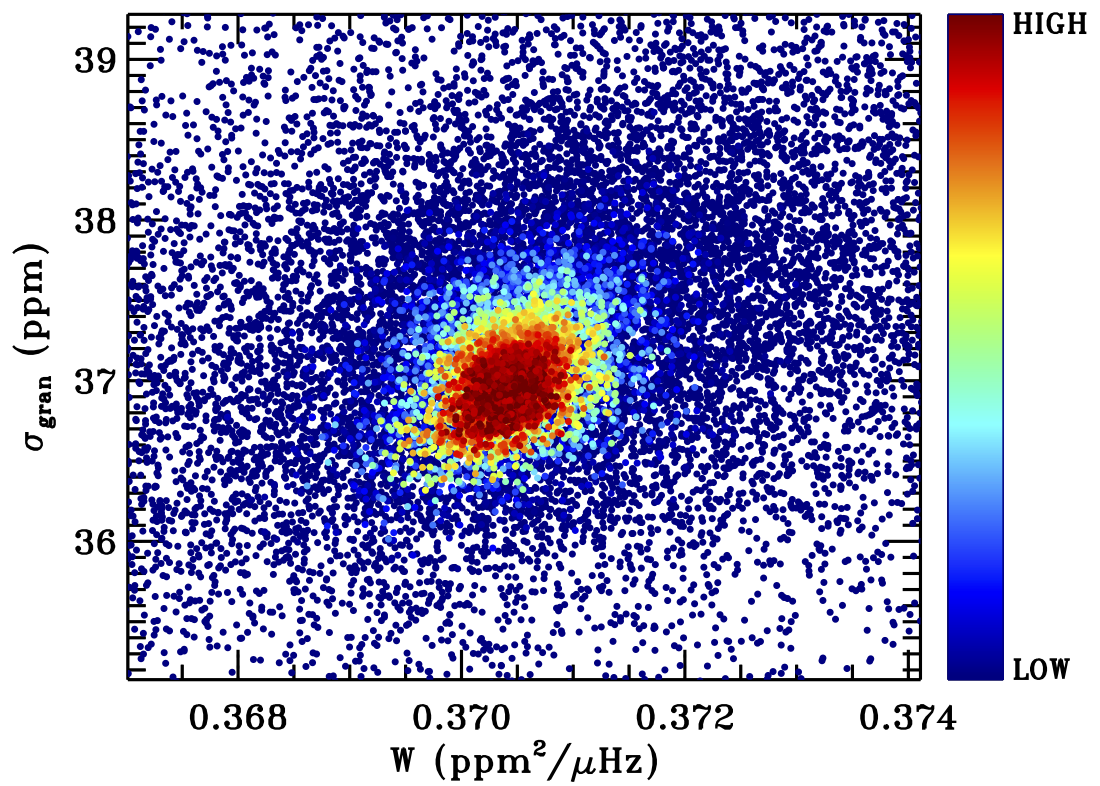
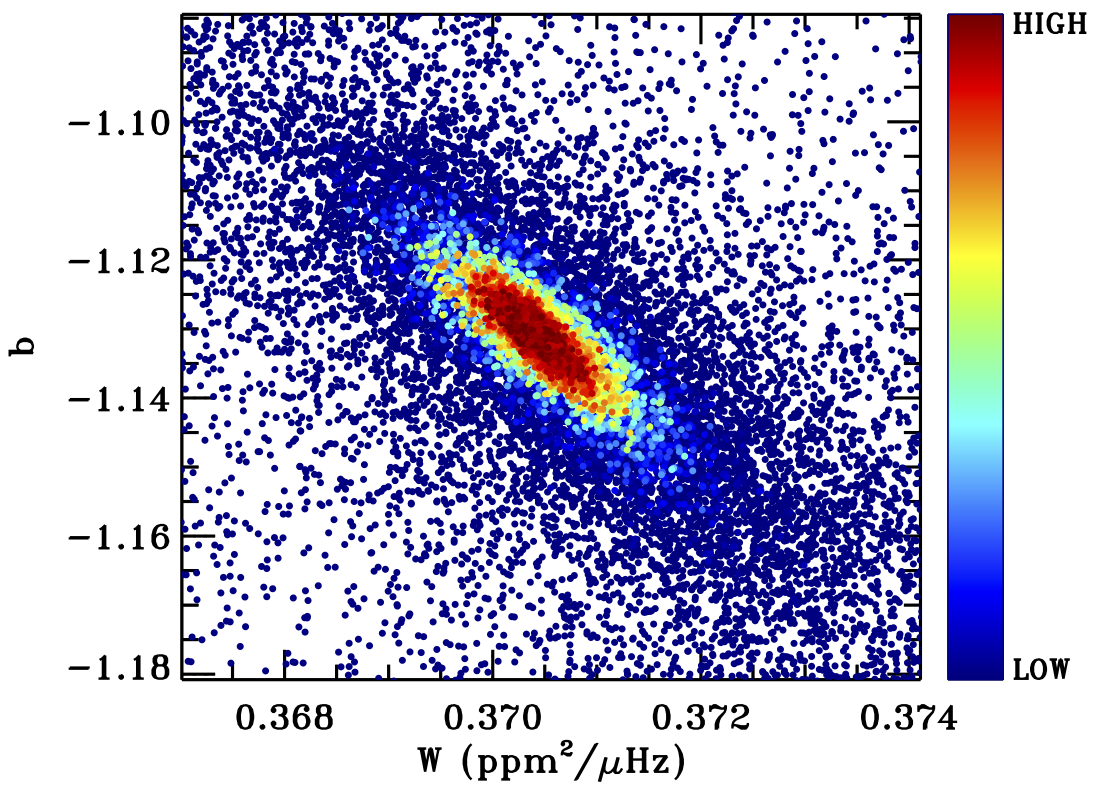
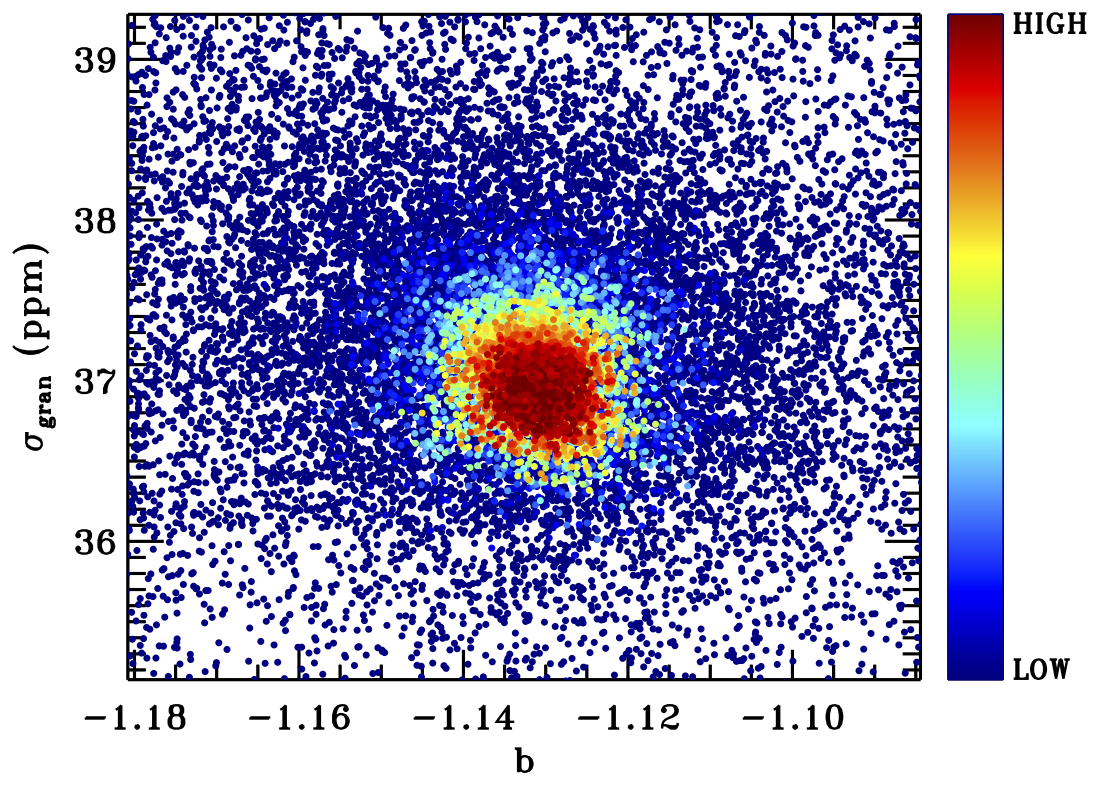
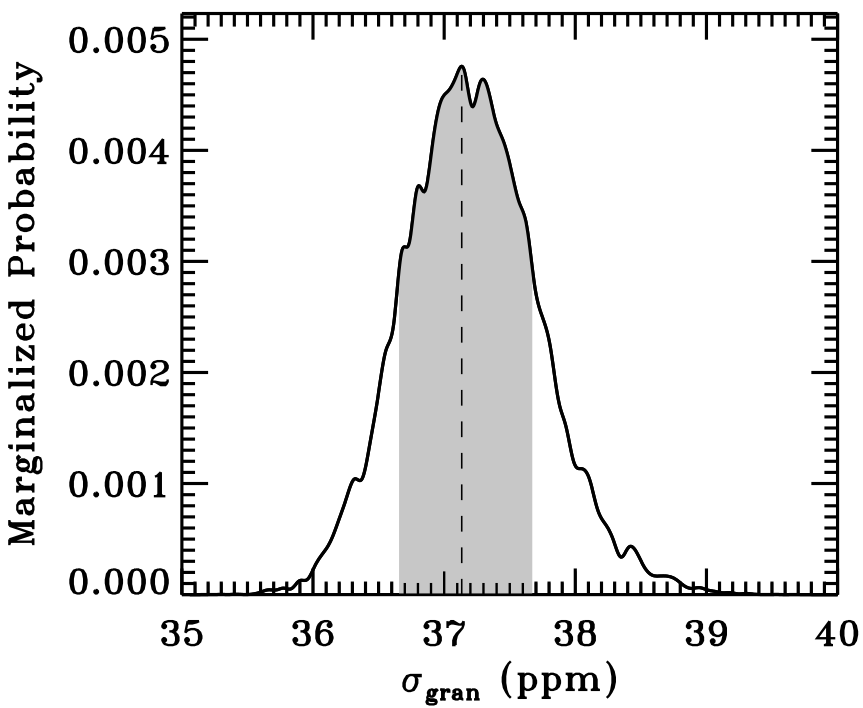
Fig. 6
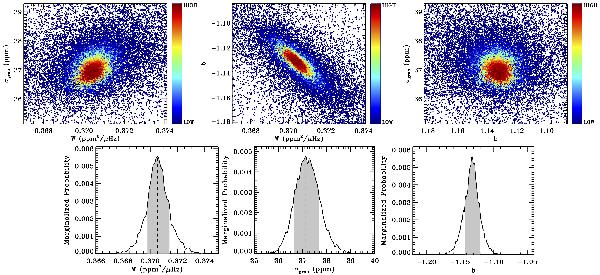
Upper panels: examples of correlation maps of the three free parameters W, σgran, and b used in Eq. (27) using two Harvey-like profiles with color-coded likelihood values. Each point in the diagram is a sampling point that stems from the NSMC process. The plotted realization consists of ~27 000 samples. Lower panels: corresponding MPDs of the free parameters as computed by means of Diamonds. The shaded region indicates the portion of the distribution containing 68.3% of the total probability, defining the shortest credible intervals listed in Table 1. The dashed line indicates the mode of the distribution.
Current usage metrics show cumulative count of Article Views (full-text article views including HTML views, PDF and ePub downloads, according to the available data) and Abstracts Views on Vision4Press platform.
Data correspond to usage on the plateform after 2015. The current usage metrics is available 48-96 hours after online publication and is updated daily on week days.
Initial download of the metrics may take a while.