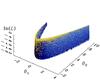
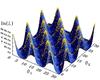
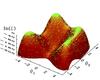
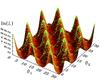
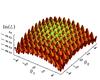
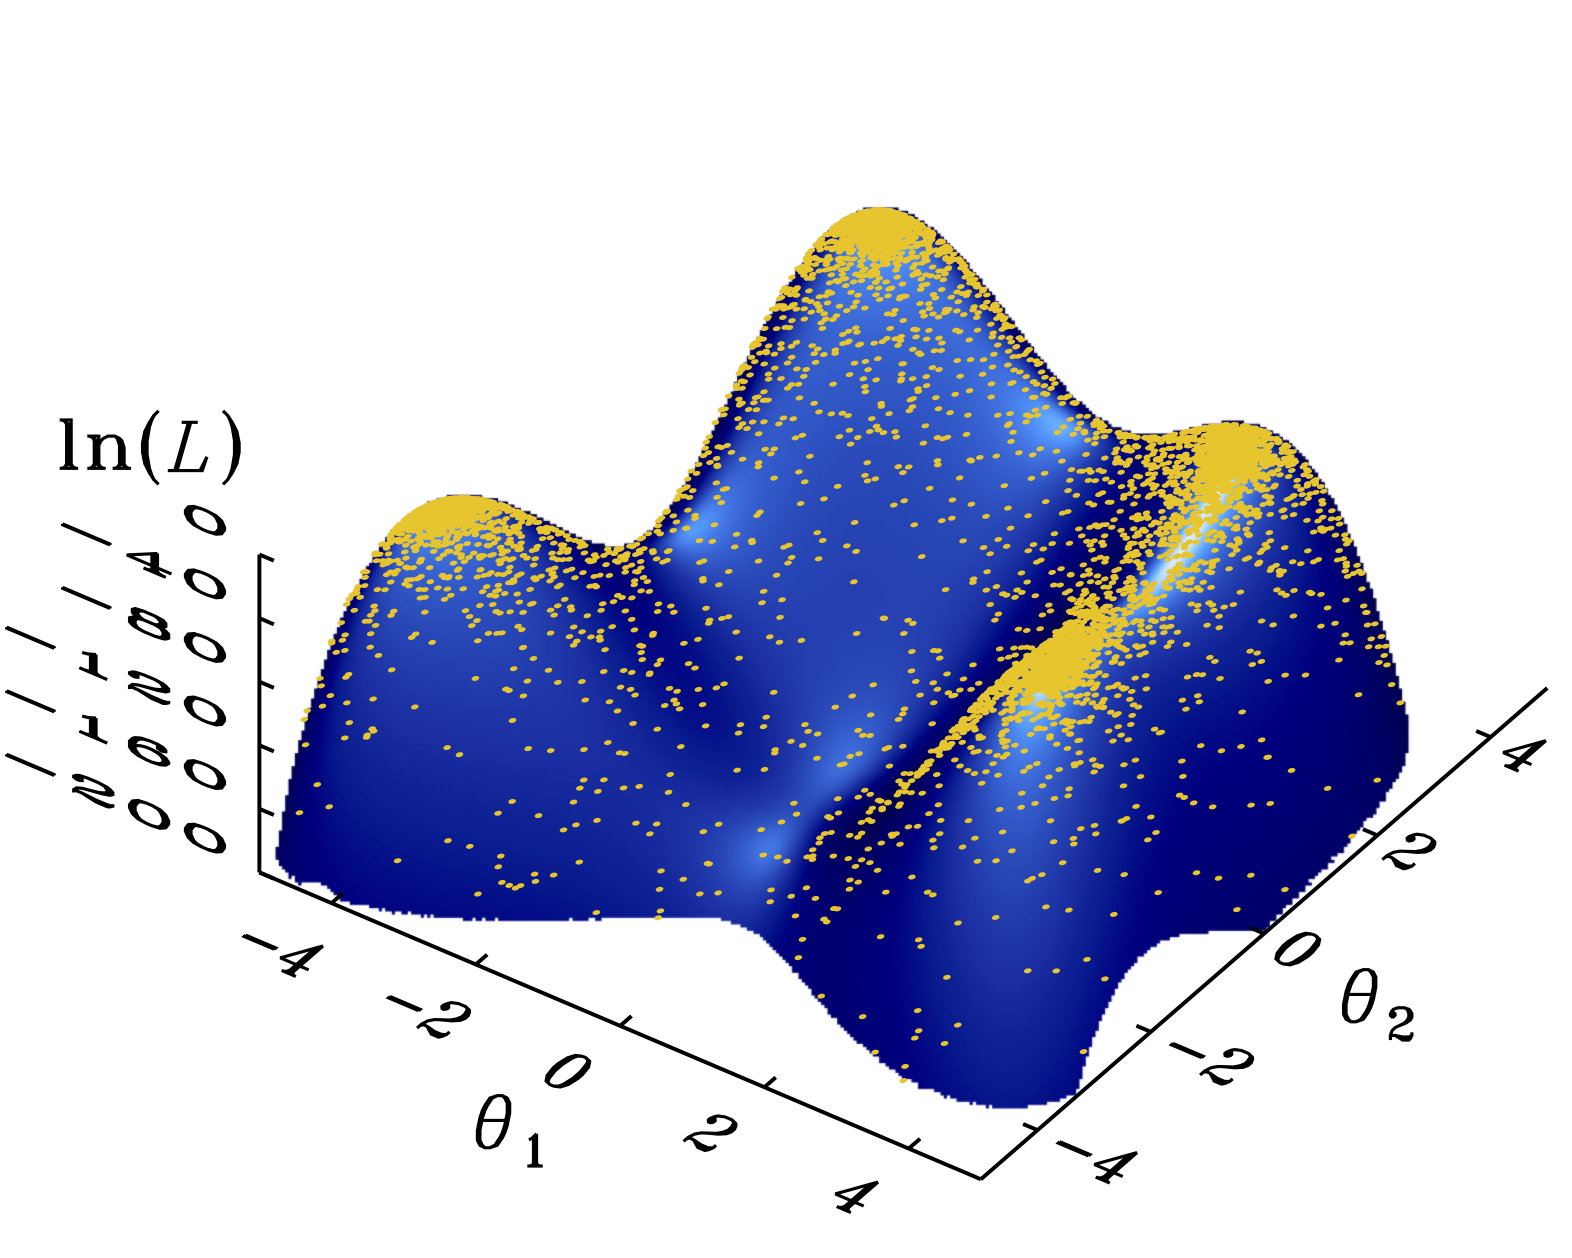
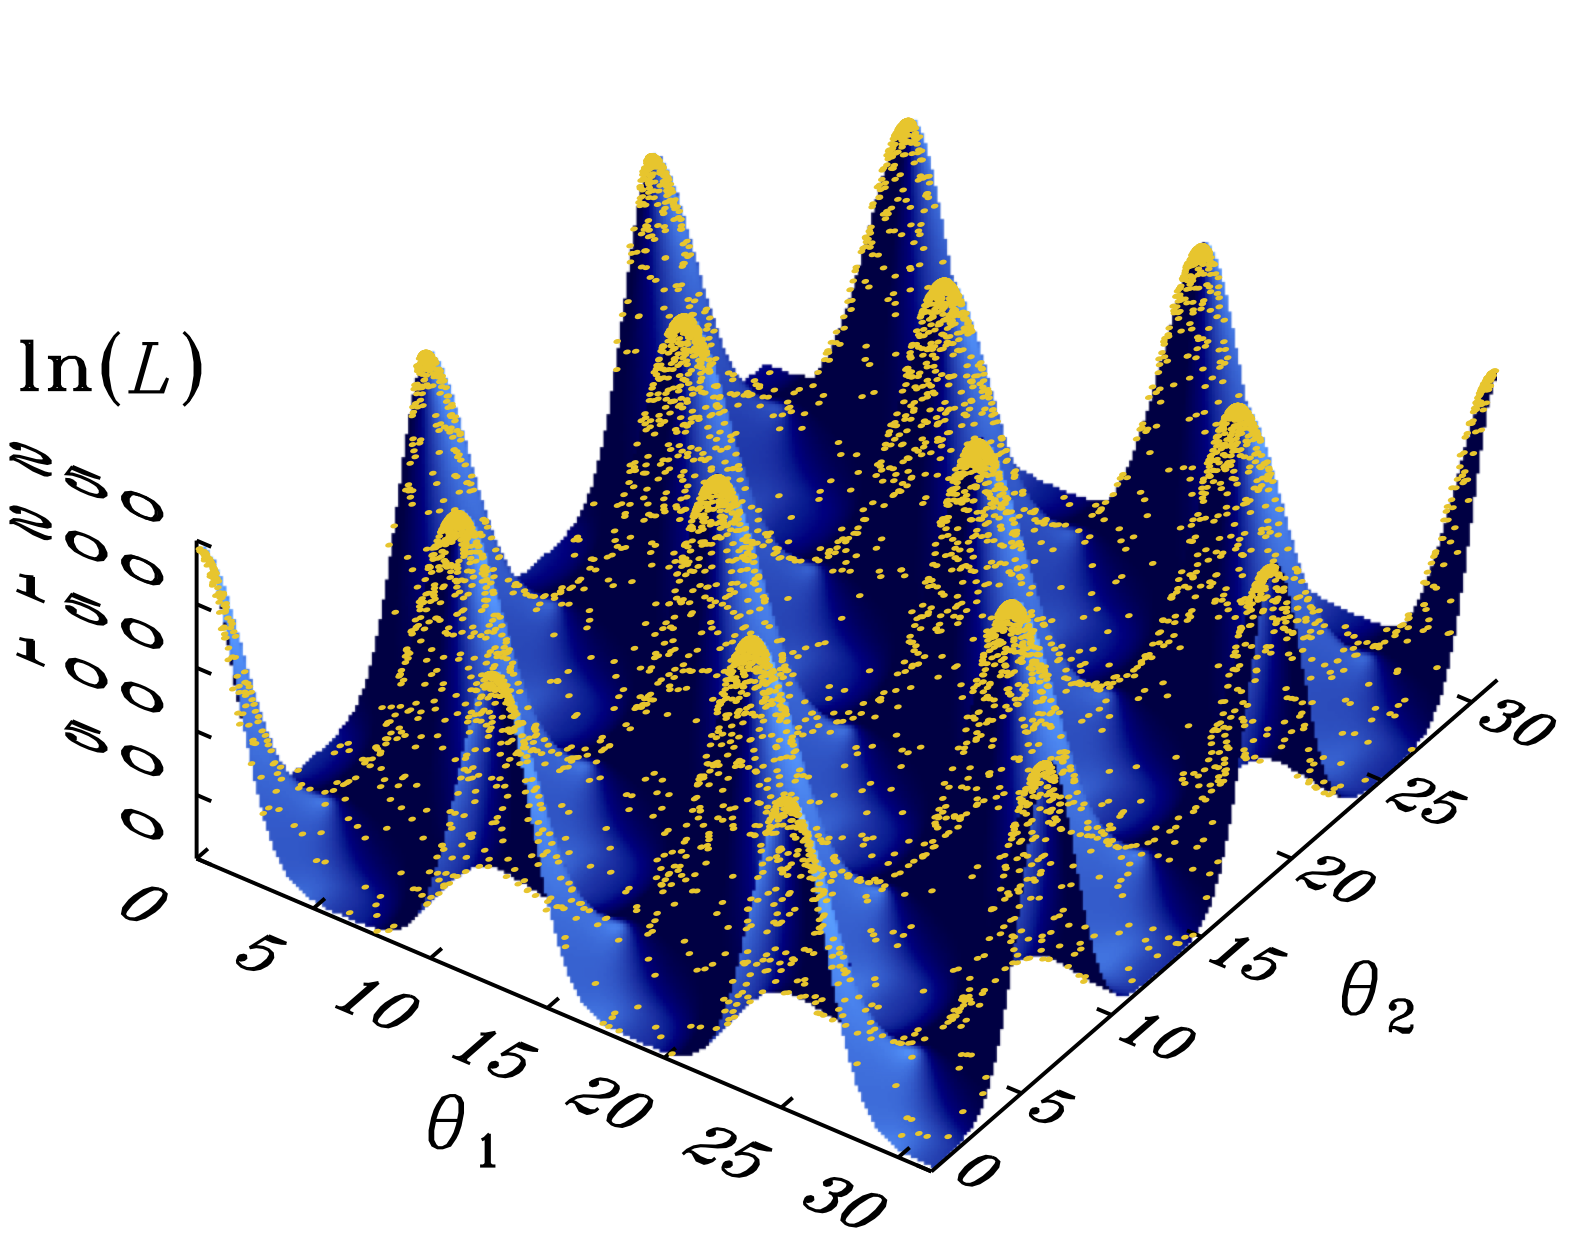
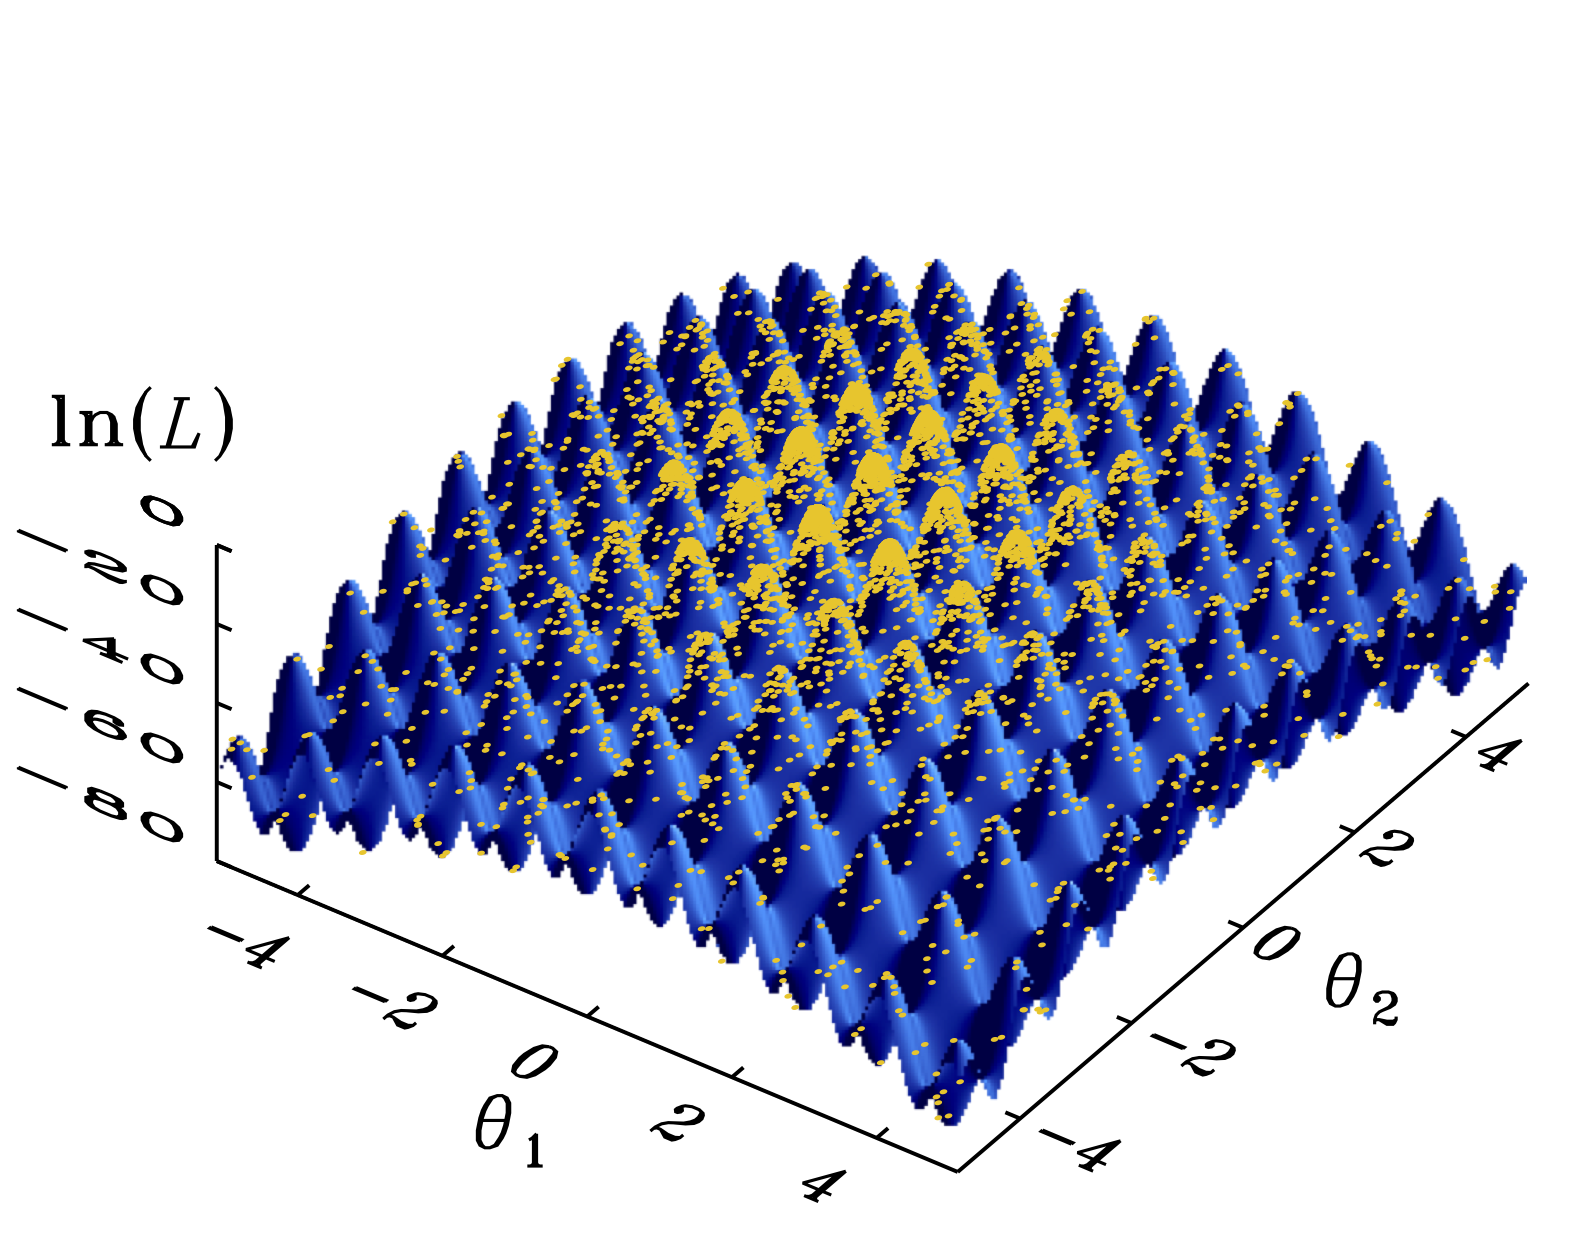
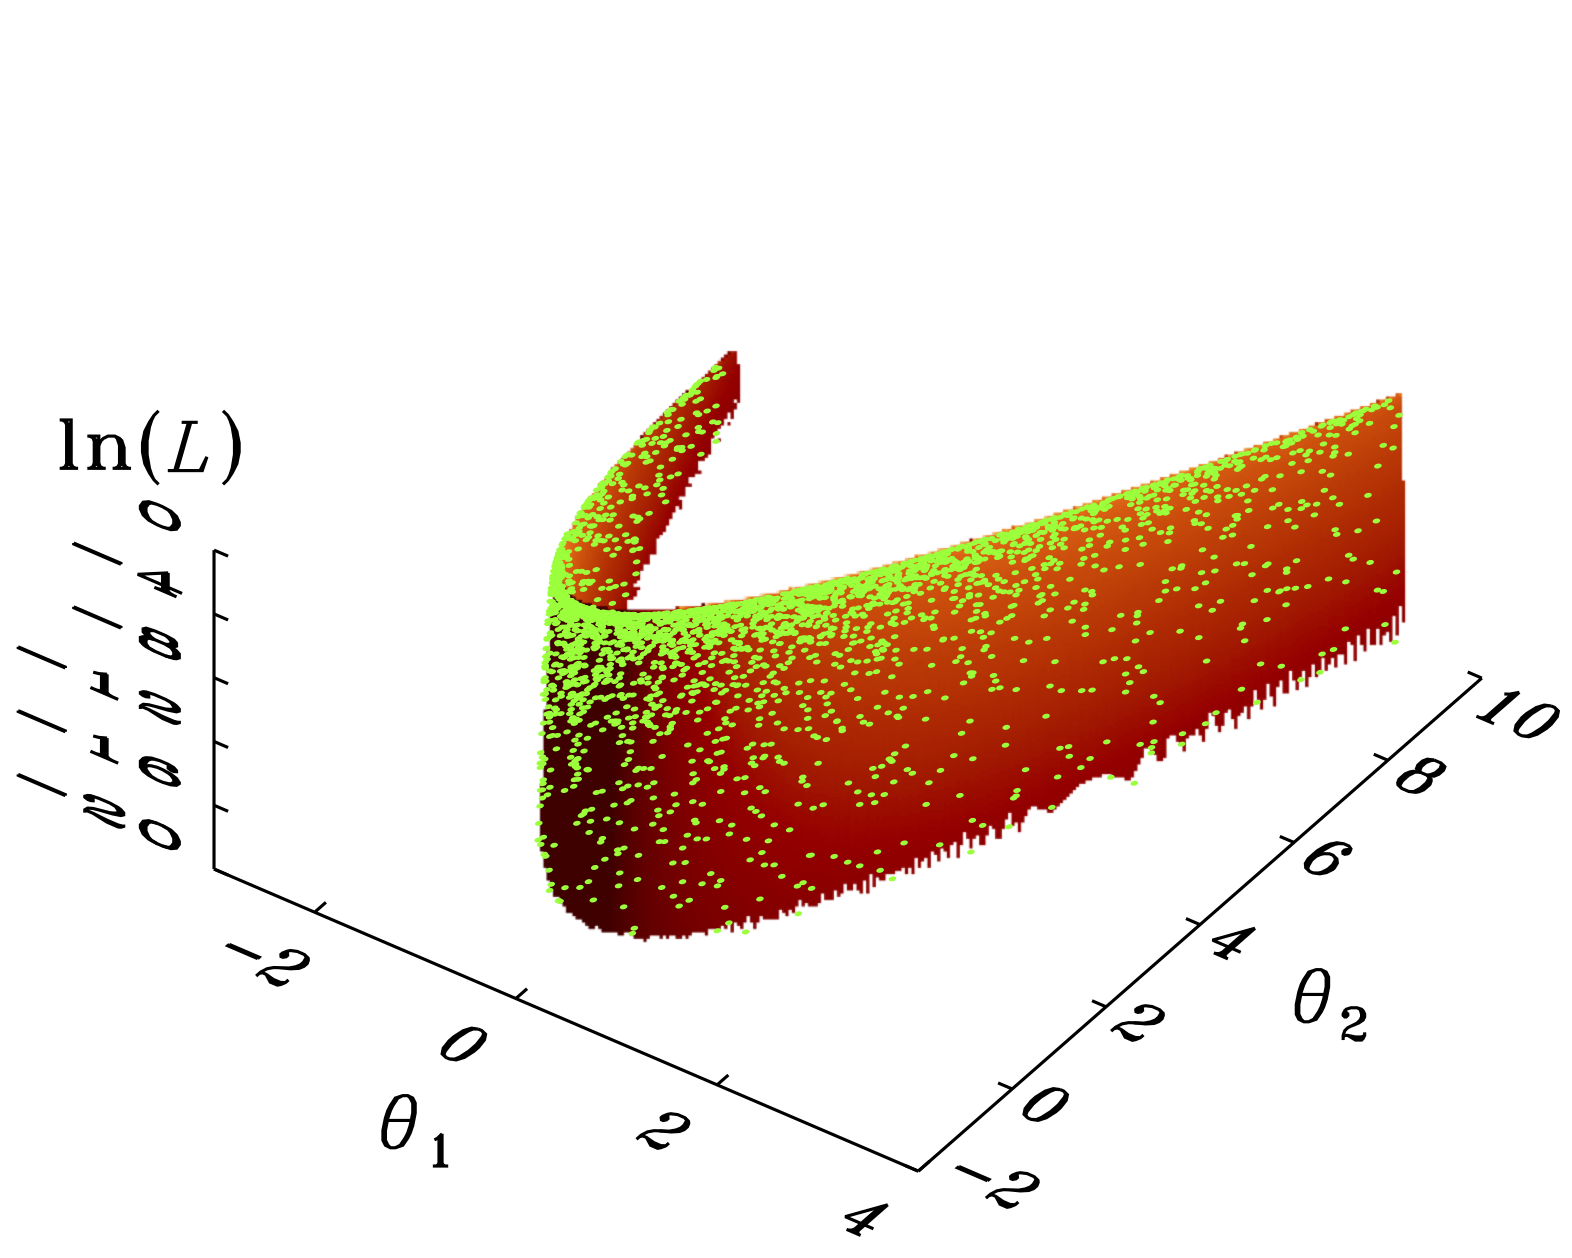
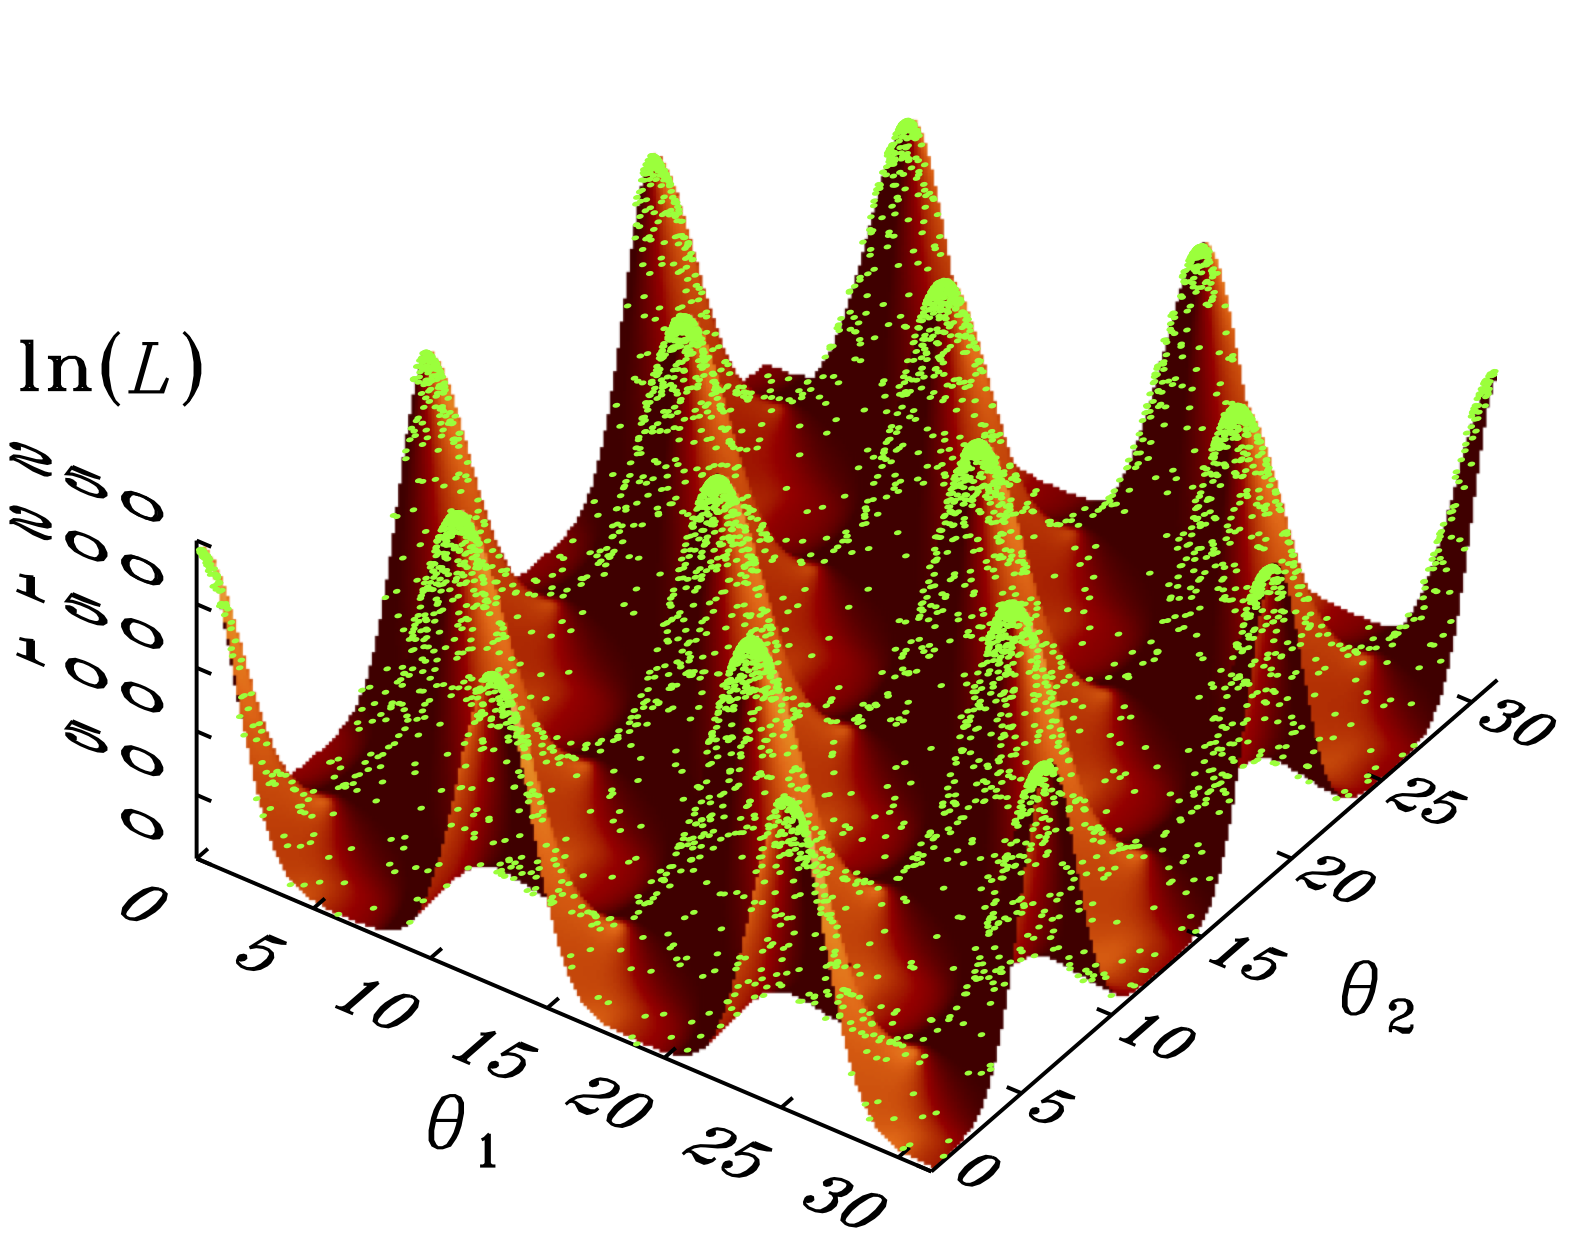
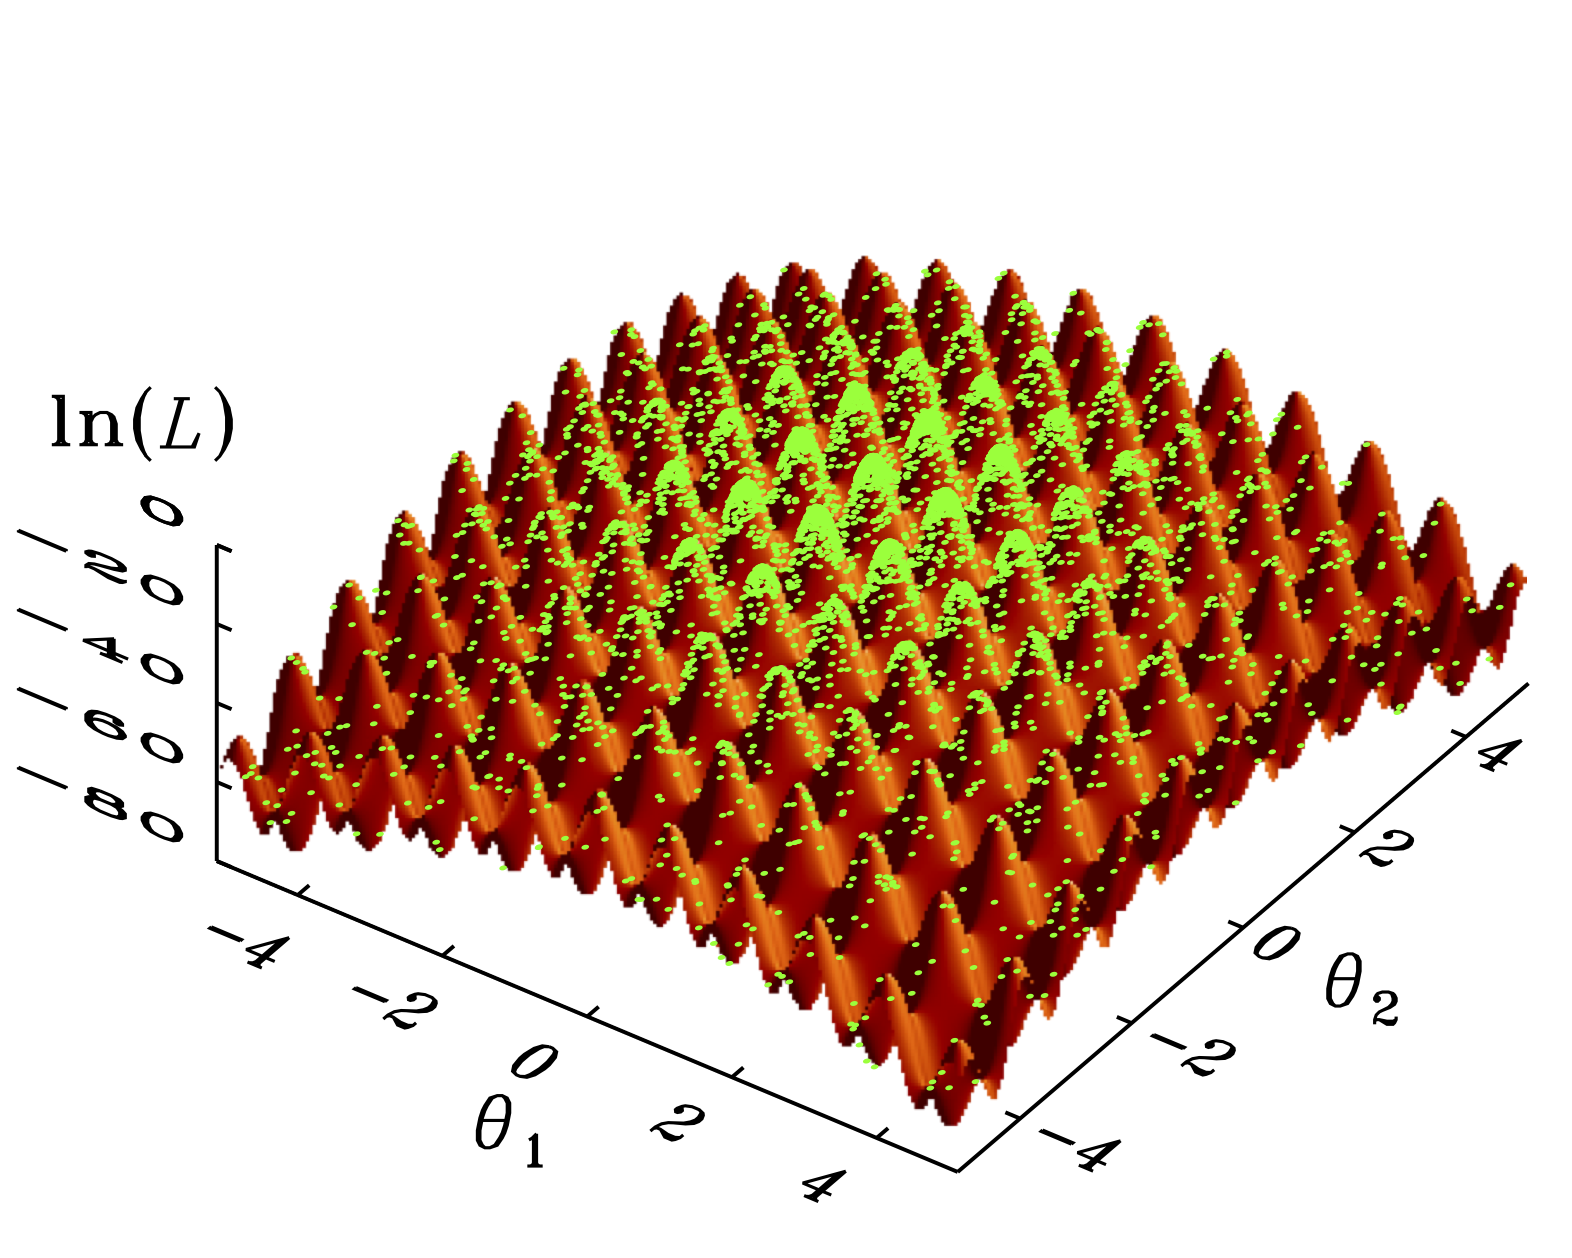
Fig. 3
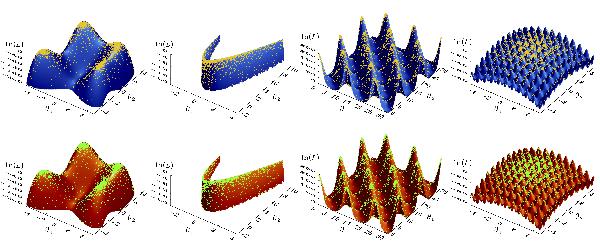
Shaded surfaces show Himmelblau’s function in the range θ1,θ2 ∈ [−5,5] (left), Rosenbrock’s function in the range θ1 ∈ [−3,4] and θ2 ∈ [−2,10] (middle left), Eggbox function in the range θ1,θ2 ∈ [0,10π] (middle right) and Rastrigin’s function in the range θ1,θ2 ∈ [−5.12,5.12] (right). Uniform priors over each coordinate were used for all the demos with stopping thresholds δfinal = 0.05,0.05,0.5, and 0.05, respectively. Upper panels: yellow dots represent (from left to right) the resulting Nnest = 8485, 8558, 8207, 10648 samples obtained with the code presented in Sect. 4 by using Nlive = 1000 points for each demo, as presented by FS13. Lower panels: green dots represent (from left to right) the resulting Nnest = 5286,5151,5874,6174 samples derived by additionally applying the reduction law given by Eq. (17) with tol = 100, γ = 0.4, N0 = 1000 and Nmin = 400 live points.


Current usage metrics show cumulative count of Article Views (full-text article views including HTML views, PDF and ePub downloads, according to the available data) and Abstracts Views on Vision4Press platform.
Data correspond to usage on the plateform after 2015. The current usage metrics is available 48-96 hours after online publication and is updated daily on week days.
Initial download of the metrics may take a while.