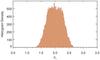
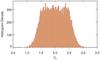
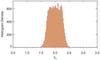
Fig. 2
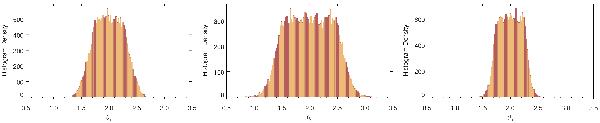
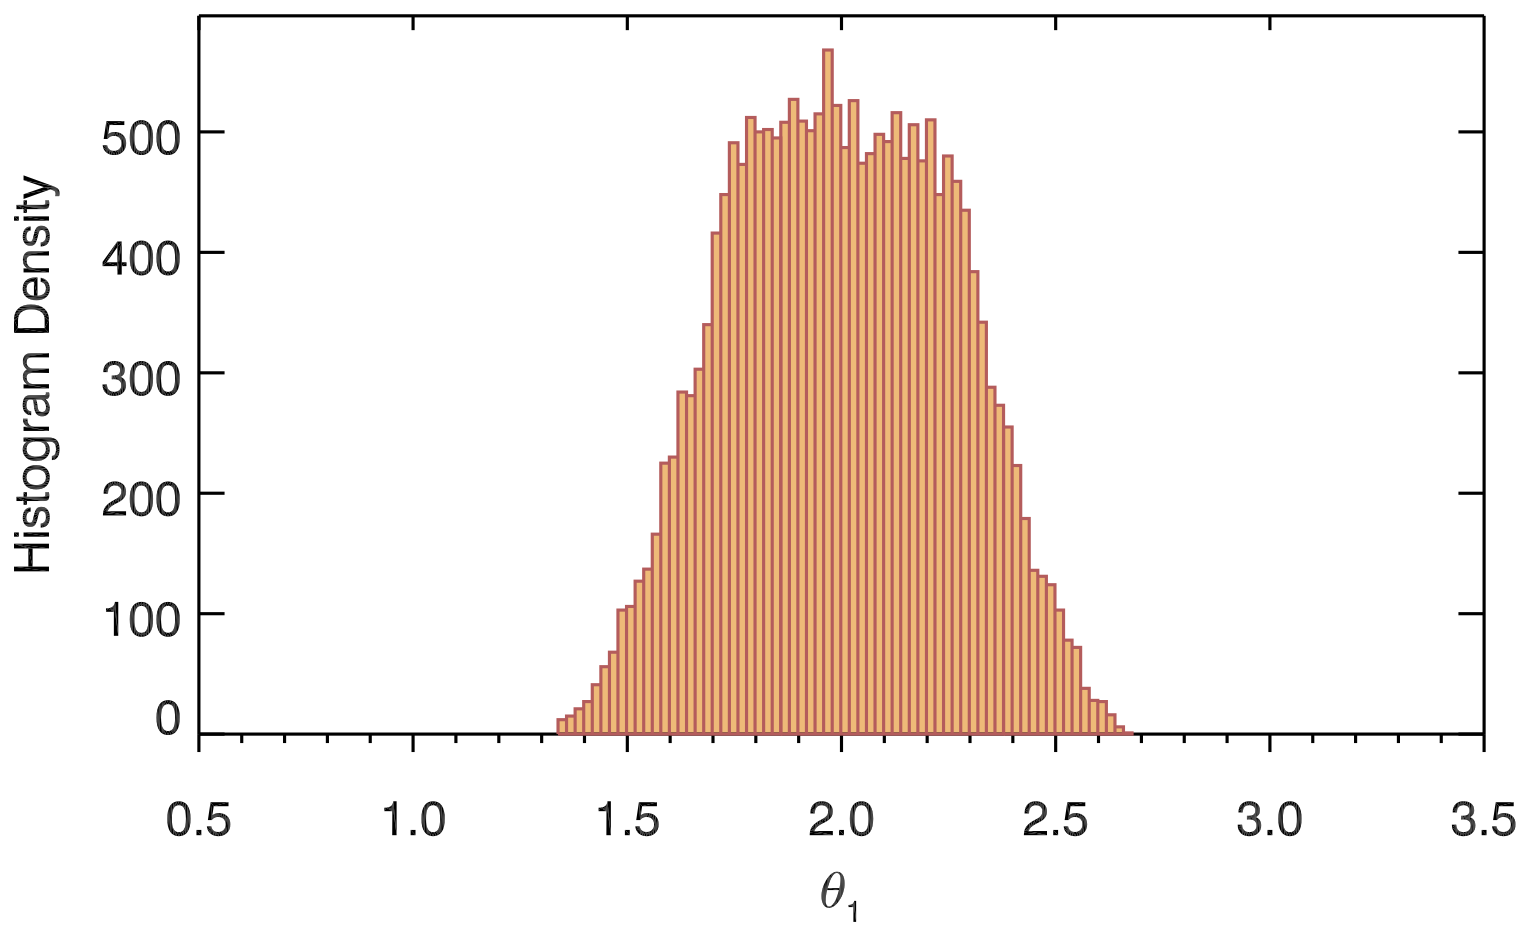
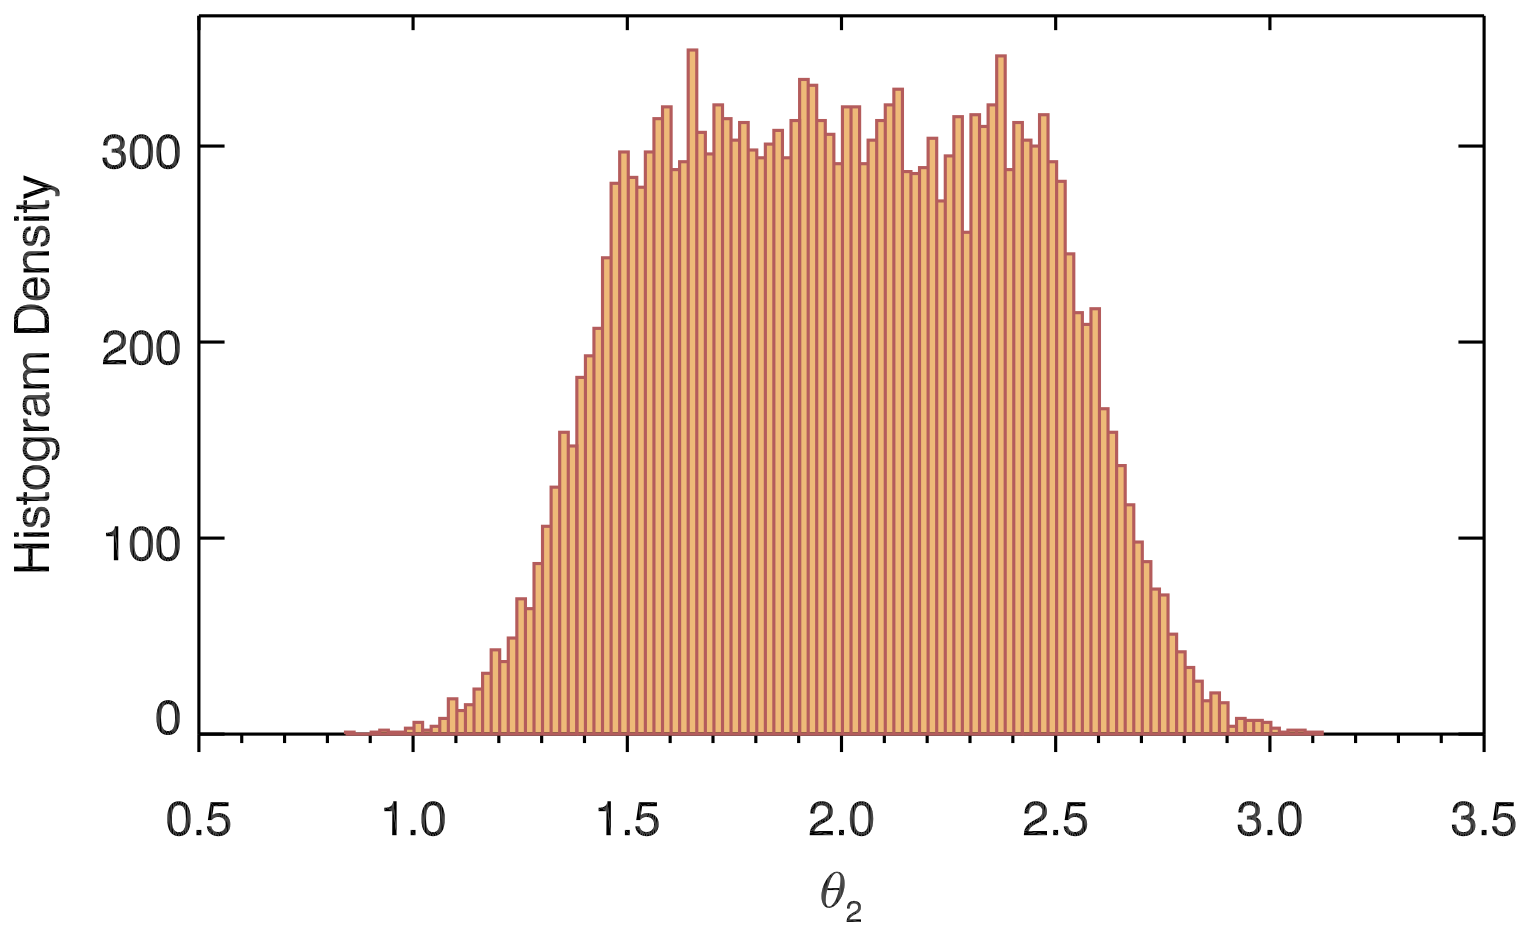
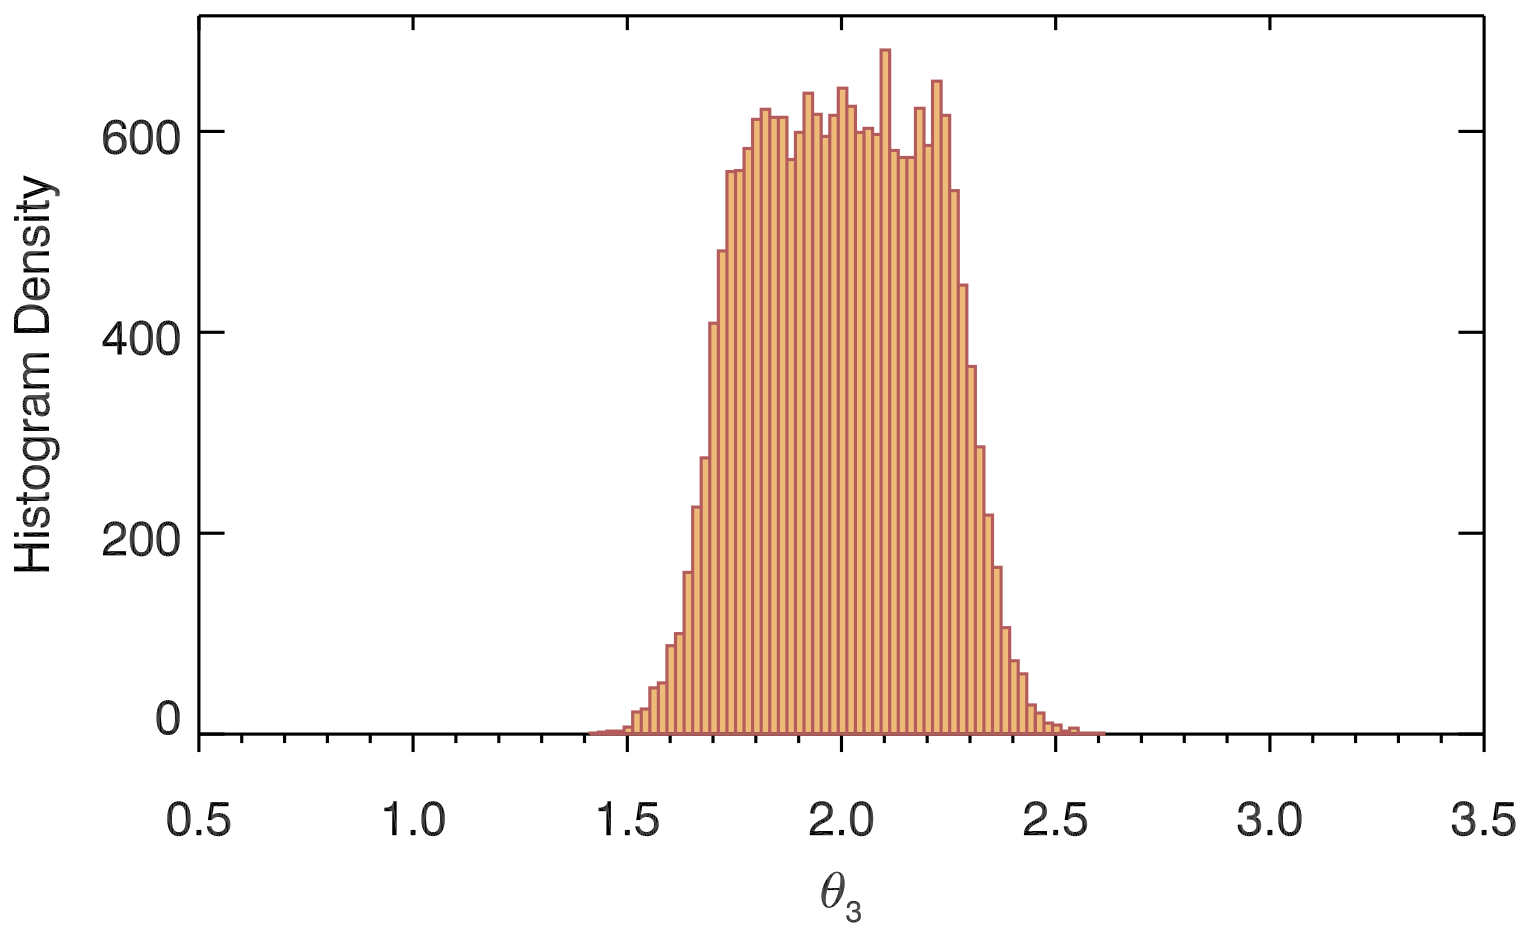
Examples of 20 000 points drawn from the 3D ellipsoid used in Fig. 1 but now according to the super-Gaussian priors ![]() . Panels from left to right show the histogram densities of the number of drawn points per dimension. By definition, the histogram corresponding to the coordinate θ2 has a plateau with twice the width of the plateau of the other two coordinates, while we see the same spread in the tails of the histograms for θ1 and θ2 and a smaller one for that of θ3. All the distributions are also centered in the given input center position.
. Panels from left to right show the histogram densities of the number of drawn points per dimension. By definition, the histogram corresponding to the coordinate θ2 has a plateau with twice the width of the plateau of the other two coordinates, while we see the same spread in the tails of the histograms for θ1 and θ2 and a smaller one for that of θ3. All the distributions are also centered in the given input center position.
Current usage metrics show cumulative count of Article Views (full-text article views including HTML views, PDF and ePub downloads, according to the available data) and Abstracts Views on Vision4Press platform.
Data correspond to usage on the plateform after 2015. The current usage metrics is available 48-96 hours after online publication and is updated daily on week days.
Initial download of the metrics may take a while.