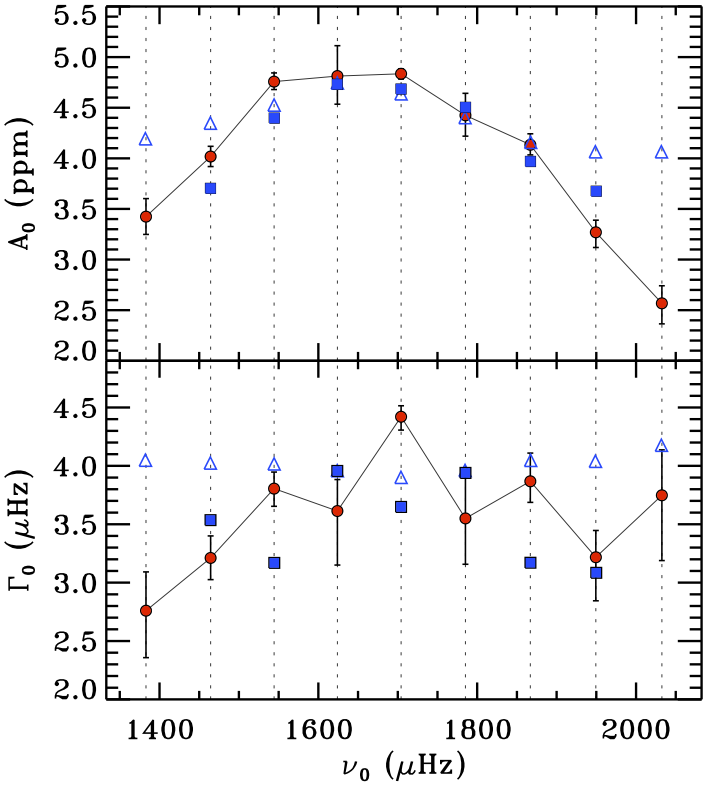
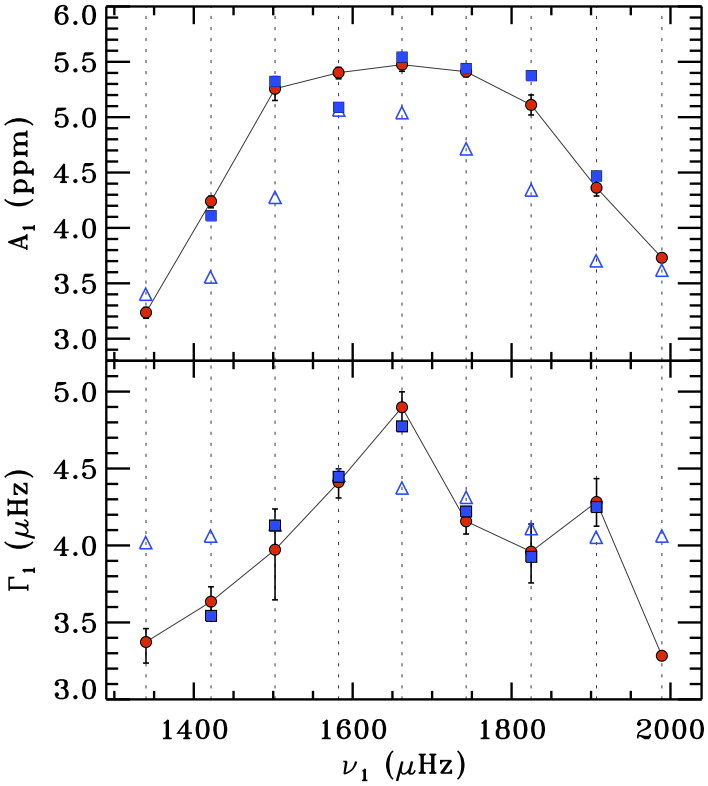
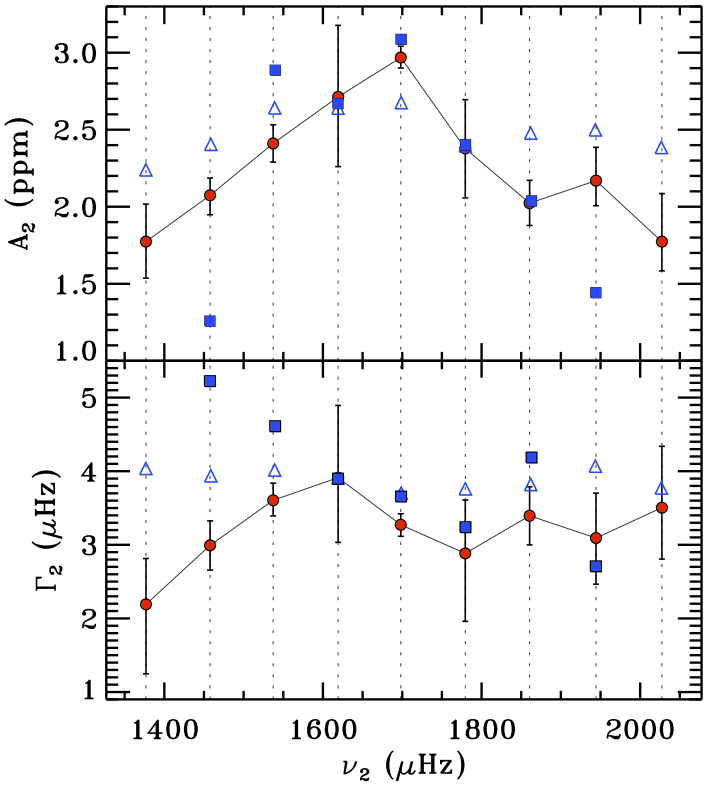
Fig. 14
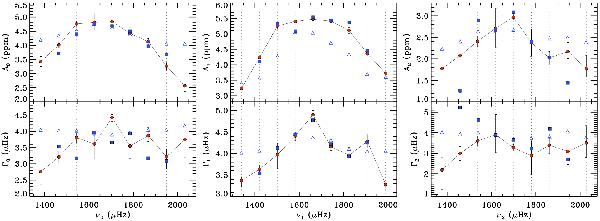
Comparison of the results for KIC 9139163 relative to the nine radial orders in the frequency range 1280 − 2090 μHz, obtained by Diamonds according to Approach 1 (red circles) and Approach 2 (blue squares). Panels from left to right show the amplitudes (upper panels) and linewidths (lower panels) against the frequency position of the full set of radial, ν0, dipole, ν1, and quadrupole oscillations, ν2, respectively. The red circles are the mean values as derived from the MPDs with their corresponding 68.3% shortest credible intervals, while the blue squares are the mean values from the MPDs of each blue island (see Fig. 13). The open triangles are the sample average positions (see Fig. 13) used for providing a frequency estimate for the two side peaks of each panel. Dotted vertical lines represent the frequency position of the red circles, as shown as a reference for the blue squares.
Current usage metrics show cumulative count of Article Views (full-text article views including HTML views, PDF and ePub downloads, according to the available data) and Abstracts Views on Vision4Press platform.
Data correspond to usage on the plateform after 2015. The current usage metrics is available 48-96 hours after online publication and is updated daily on week days.
Initial download of the metrics may take a while.