Fig. 13
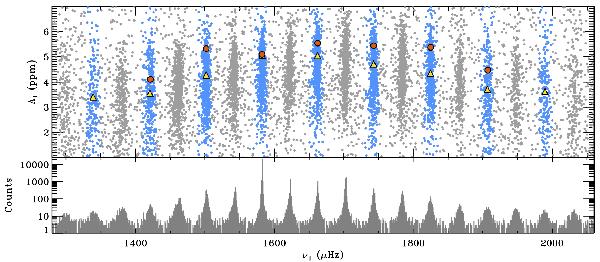
Resulting 43374 samples obtained by Diamonds by using Approach 2 applied to the PSD of KIC 9139163 in the frequency range 1280 − 2090 μHz, covering nine radial orders. Upper panel: distribution of the sampling points for the amplitude of dipole peaks, A1 and the corresponding frequency position, ν1. The islands marked in light blue represent the true positions of the dipole peaks, while those in gray are relative to the positions of the blended quadrupole-radial peaks, which are ignored. The red circles represent the mean Bayesian estimates derived from the MPDs of the light blue islands, while yellow triangles show the corresponding sampling average positions in both coordinates and are not related to the MPDs. Lower panel: corresponding histogram density along the direction of ν1, showing the number of counts occurring in each island.
Current usage metrics show cumulative count of Article Views (full-text article views including HTML views, PDF and ePub downloads, according to the available data) and Abstracts Views on Vision4Press platform.
Data correspond to usage on the plateform after 2015. The current usage metrics is available 48-96 hours after online publication and is updated daily on week days.
Initial download of the metrics may take a while.