Free Access
Fig. 12
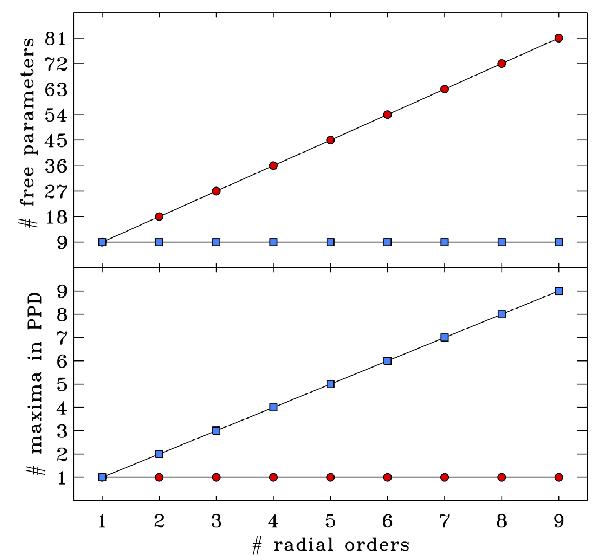
Illustrative comparison between Approach 1 (red circles) and Approach 2 (blue squares) in terms of the number of free parameters used in the fit (top panel) and the number of local maxima identified in the final PPD (bottom panel), as a function of the number of radial orders considered.
Current usage metrics show cumulative count of Article Views (full-text article views including HTML views, PDF and ePub downloads, according to the available data) and Abstracts Views on Vision4Press platform.
Data correspond to usage on the plateform after 2015. The current usage metrics is available 48-96 hours after online publication and is updated daily on week days.
Initial download of the metrics may take a while.