Fig. 11
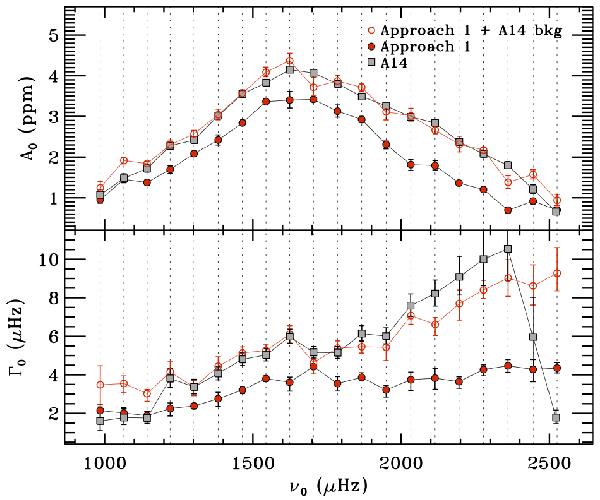
Comparison of the oscillation parameters for the radial peaks of KIC 9139163 between the results derived in this work by means of Diamonds (filled red circles, Approach 1 based on the background derived in Sect. 6.2 and, open red circles, Approach 1 based on A14 background) and those provided by A14 (gray squares) for both amplitudes A0 (upper panel), and linewidths Γ0 (lower panel), as a function of the frequency position ν0. The red circles represent the mean estimates coming from the Bayesian inference with their corresponding 68.3% credible intervals, while gray squares are the mean estimates from the MLE fit done by A14 and plotted with their error bars. The A0 values from Approach 1 shown in the plot are obtained by scaling down by a factor ![]() those reported in Tables A.1 and B.1 to be consistent with the definition of amplitude indicated by A14. Dotted vertical lines mark the frequency position of the red circles for a better visual comparison with that of the gray squares.
those reported in Tables A.1 and B.1 to be consistent with the definition of amplitude indicated by A14. Dotted vertical lines mark the frequency position of the red circles for a better visual comparison with that of the gray squares.
Current usage metrics show cumulative count of Article Views (full-text article views including HTML views, PDF and ePub downloads, according to the available data) and Abstracts Views on Vision4Press platform.
Data correspond to usage on the plateform after 2015. The current usage metrics is available 48-96 hours after online publication and is updated daily on week days.
Initial download of the metrics may take a while.