Fig. 1
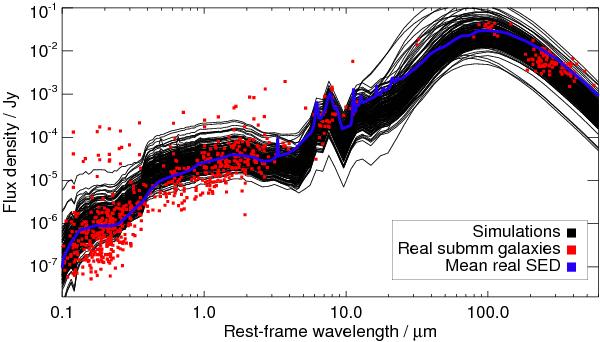
Spectral energy distributions of the simulated submm galaxies (solid black lines) and the real submm galaxies (red squares for individual galaxies and blue line for the average model; both from the compilation of Michałowski et al. 2010a), showing that the simulations correctly represent the real galaxies (no scaling of photometric datapoints has been applied).
Current usage metrics show cumulative count of Article Views (full-text article views including HTML views, PDF and ePub downloads, according to the available data) and Abstracts Views on Vision4Press platform.
Data correspond to usage on the plateform after 2015. The current usage metrics is available 48-96 hours after online publication and is updated daily on week days.
Initial download of the metrics may take a while.