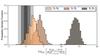
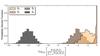
Fig. 9

Upper panel: odds ratio of scenario 1 against scenarios 0, 2, and 3. The grey regions indicate the “not worth more than a bare mention”, “positive”, and “strong” evidence as defined by Kass & Raftery (1995). The white region corresponds to “very strong” evidence for one model against the other one. Lower panel: probability of each of the four scenarios considered. We assume here that the other, untested scenarios are not significant (see Sect. 4).
Current usage metrics show cumulative count of Article Views (full-text article views including HTML views, PDF and ePub downloads, according to the available data) and Abstracts Views on Vision4Press platform.
Data correspond to usage on the plateform after 2015. The current usage metrics is available 48-96 hours after online publication and is updated daily on week days.
Initial download of the metrics may take a while.