Fig. 7
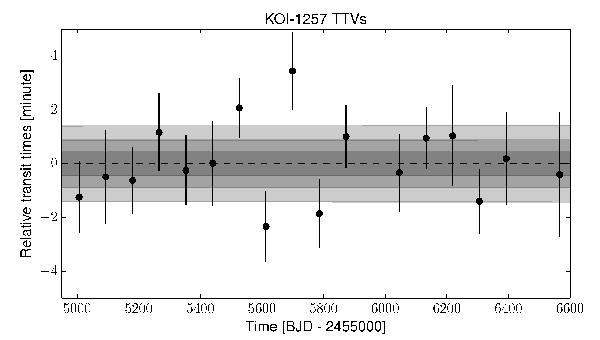
Transit times of KOI-1257.01 compared to the best linear ephemeris found in Model C (dashed line). The grey regions represent the 63.8%, 95.5%, and 99.7% confidence regions of the best linear ephemeris (from dark to light grey). The confidence regions account for the covariance between the orbital period and the epoch of first transit, but this covariance is too small to be visible in this plot.
Current usage metrics show cumulative count of Article Views (full-text article views including HTML views, PDF and ePub downloads, according to the available data) and Abstracts Views on Vision4Press platform.
Data correspond to usage on the plateform after 2015. The current usage metrics is available 48-96 hours after online publication and is updated daily on week days.
Initial download of the metrics may take a while.