Fig. 6
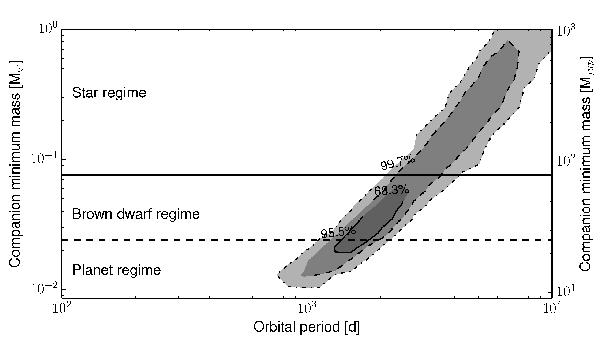
Posterior distribution of the second companion minimum mass as a function of its orbital period, assuming a circular orbit. The three regions represent the 68.3%, 95.5%, and 99.7% confidence intervals from the MCMC analysis (from dark to light grey). The dashed line indicates the planet – brown dwarf limit as suggested by Schneider et al. (2011). The solid line indicates the hydrogen-burning limit.
Current usage metrics show cumulative count of Article Views (full-text article views including HTML views, PDF and ePub downloads, according to the available data) and Abstracts Views on Vision4Press platform.
Data correspond to usage on the plateform after 2015. The current usage metrics is available 48-96 hours after online publication and is updated daily on week days.
Initial download of the metrics may take a while.