Fig. 3
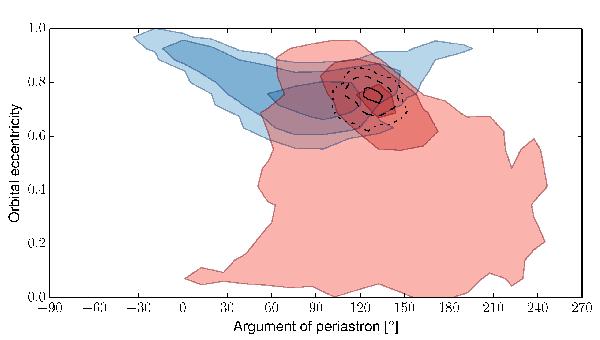
Posterior distribution of the orbital eccentricity versus the argument of periastron as constrained independently by the Kepler transit light curve (model A, in blue), the radial velocities (model B, in red), and the combined analysis (model C, with the black contours). The regions represent the 68.3%, 95.5%, and 99.7% confidence intervals.
Current usage metrics show cumulative count of Article Views (full-text article views including HTML views, PDF and ePub downloads, according to the available data) and Abstracts Views on Vision4Press platform.
Data correspond to usage on the plateform after 2015. The current usage metrics is available 48-96 hours after online publication and is updated daily on week days.
Initial download of the metrics may take a while.