Fig. 2
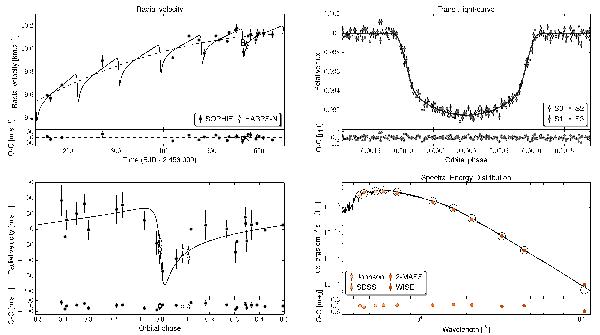
Top-left panel: SOPHIE and HARPS-N time series superimposed with the best-fit model of the Keplerian orbit of KOI-1257.01 and the quadratic drift of the outer companion (dashed line). The best-fit residuals are shown. Bottom-left panel: phase-folded radial velocities from SOPHIE and HARPS-N after removing the quadratic drift. The best Keplerian model and its residuals are also displayed. Top-right panel: phase-folded transit light curve of KOI-1257.01 as observed during the four years of the Kepler mission. The best-fit model is superimposed to the data and the residuals from the best-fit model (in parts per thousand – ppt) are also displayed. The four different seasons of the Kepler spacecraft have different marks (see legend). Bottom-right panel: spectral energy distribution of KOI-1257 as shown in Table 1. The best stellar atmosphere model from the BT-SETTL library is also shown here together with the residuals. The best displayed models are those from Model C described in Sect. 3.6. The error bars displayed in these plots were increased quadratically by the jitter value fitted in the analyses.
Current usage metrics show cumulative count of Article Views (full-text article views including HTML views, PDF and ePub downloads, according to the available data) and Abstracts Views on Vision4Press platform.
Data correspond to usage on the plateform after 2015. The current usage metrics is available 48-96 hours after online publication and is updated daily on week days.
Initial download of the metrics may take a while.