Fig. B.1
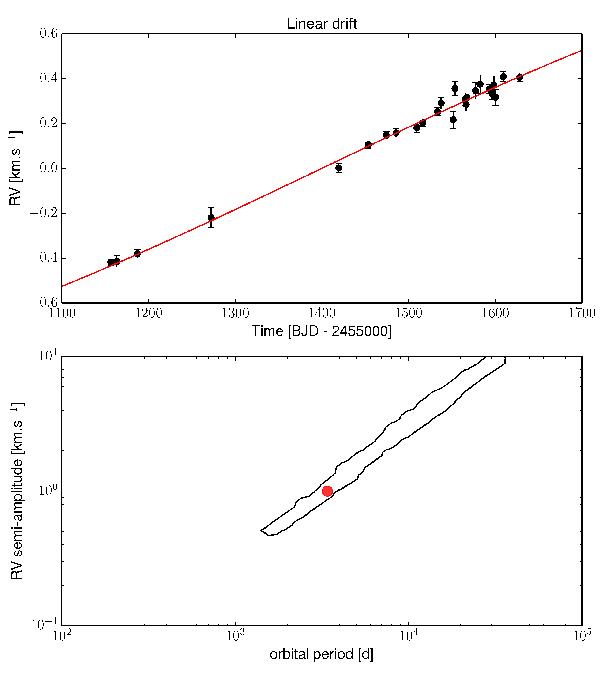
Top panel: synthetic radial velocity dataset (black points) superimposed with the circular orbit model (red line) used to generate the data. This model shows only a linear drift during the timespan of the observations. Bottom panel: the 99.7% confidence region of the posterior distribution for the orbital period versus the radial velocity semi-amplitude (black line). The modelled orbit is marked with the red circle. The upper limit in the radial velocity amplitude (at 10 km s-1) comes from the prior.
Current usage metrics show cumulative count of Article Views (full-text article views including HTML views, PDF and ePub downloads, according to the available data) and Abstracts Views on Vision4Press platform.
Data correspond to usage on the plateform after 2015. The current usage metrics is available 48-96 hours after online publication and is updated daily on week days.
Initial download of the metrics may take a while.