Fig. 2
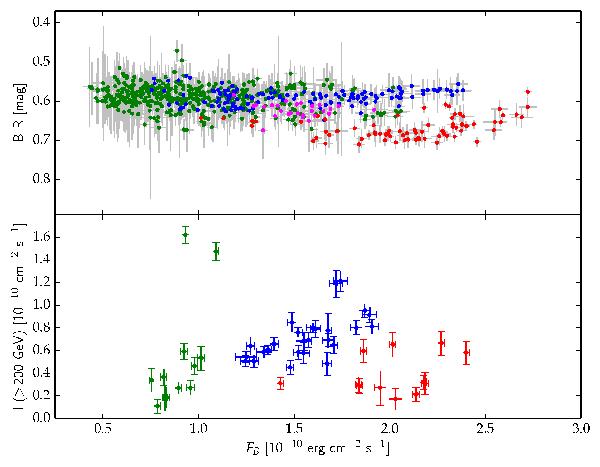
Upper panel: B − R colour vs. the B-band energy flux for PKS 2155−304 during the analysed period 2007−2009. Lower panel: corresponding VHE γ-ray photon flux of the source also as a function of the B-band energy flux. The applied colour coding is the same as in Fig. 1. We note two distinct optical spectral states appearing at high flux levels in the upper panel, and the correspondingly distinct optical–VHE correlation pattern emerging in the lower panel (green and blue points), for details see Sect. 3.4. The colour uncertainties are calculated as rms.
Current usage metrics show cumulative count of Article Views (full-text article views including HTML views, PDF and ePub downloads, according to the available data) and Abstracts Views on Vision4Press platform.
Data correspond to usage on the plateform after 2015. The current usage metrics is available 48-96 hours after online publication and is updated daily on week days.
Initial download of the metrics may take a while.