Fig. 1
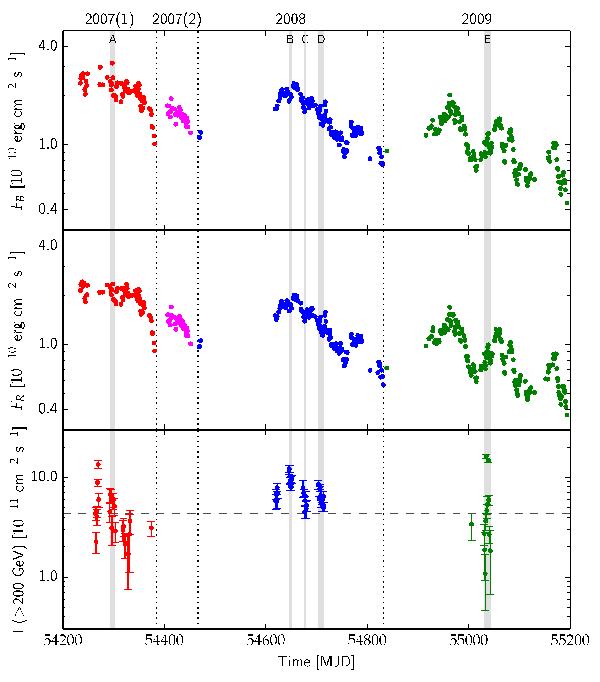
Optical (ATOM; B and R bands) and VHE γ-ray (H.E.S.S.) lightcurves of PKS 2155−304 during the period 2007–2009 (upper, middle, and bottom panels, respectively). The observations performed in 2007 until MJD 54 385 are denoted by red symbols, in 2007 after MJD 54 385 by magenta symbols, in 2008 by blue symbols, and in 2009 by green symbols; these epochs are also separated by the dotted vertical lines. For the two upper panels the error bars are within the size of the points. The optical and VHE lightcurves are binned in one-night intervals. We note uneven sampling of the lightcurves at optical and VHE frequencies, as well as different integration times between the optical and VHE exposures. The horizontal line in the lower panel indicates the quiescent state of the source, defined in Abramowski et al. (2010). The vertical grey lines indicate the A–E intervals defined in Sect. 3.4.
Current usage metrics show cumulative count of Article Views (full-text article views including HTML views, PDF and ePub downloads, according to the available data) and Abstracts Views on Vision4Press platform.
Data correspond to usage on the plateform after 2015. The current usage metrics is available 48-96 hours after online publication and is updated daily on week days.
Initial download of the metrics may take a while.